can you create a common base year financial statement using 2016 as a base


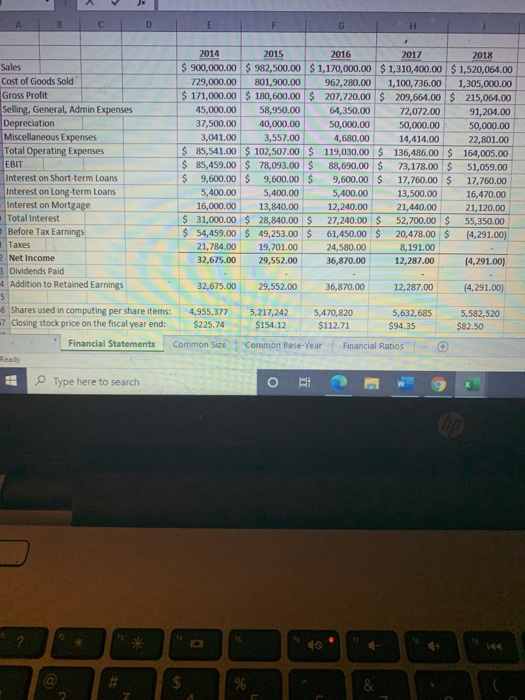
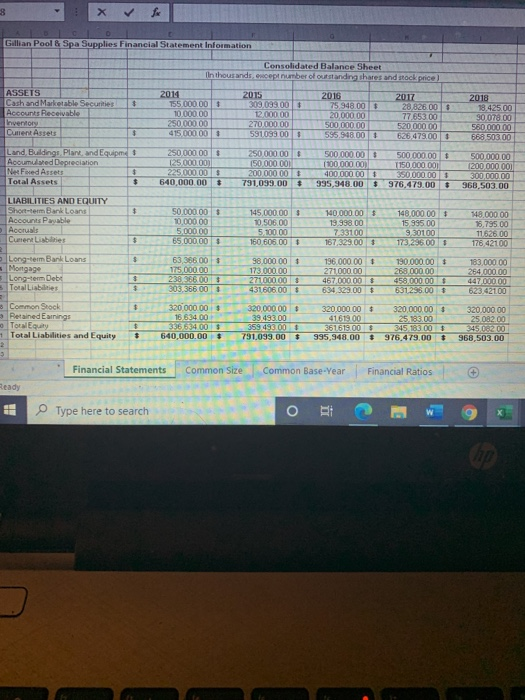
B D E G H 2014 2015 2016 2017 2018 Sales $ 900,000.00 $ 982,500.00 $ 1,170,000.00 $ 1,310,400.00 $ 1,520,064.00 Cost of Goods Sold 729,000.00 801,900.00 962,280.00 1,100,736.00 1,305,000.00 Gross Profit $ 171,000.00 $ 180,600.00 $ 207,720.00 $ 209,664.00 $ 215,064.00 Selling, General, Admin Expenses 45,000.00 58,950.00 64,350.00 72,072.00 91,204.00 Depreciation 37,500.00 40,000.00 50,000.00 50,000.00 50,000.00 Miscellaneous Expenses 3,041.00 3,557.00 4,680.00 14,414.00 22,801.00 Total Operating Expenses $ 85,541.00 $ 102,507.00 $ 119,030.00 $ 136,486.00 $164,005.00 EBIT $ 85,459.00 $ 78,093.00 $ 88,690.00 $ 73,178.00 $ 51,059.00 Interest on Short-term Loans $ 9,600.00 $ 9,600.00 $ 9,600.00 $ 17,760.00 $ 17,760.00 Interest on Long-term Loans 5,400.00 5,400.00 5,400.00 13,500.00 16,470.00 Interest on Mortgage 16,000.00 13,840.00 12,240.00 21,440.00 21,120.00 Total interest $ 31,000.00 $ 28,840.00 $ 27,240.00 $ 52,700.00 $ 55,350.00 Before Tax Earnings $ 54,459.00 $ 49,253.00 $ 61,450.00 $ 20,478.00 $ (4,291.00) Taxes 21,784.00 19,701.00 24,580.00 8,191.00 Net Income 32,675.00 29,552.00 36,870.00 12,287.00 (4,291.00) 3 Dividends Paid 4 Addition to Retained Earnings 32,675.00 29,552.00 36,870.00 12,287.00 (4,291.00) 5 5 Shares used in computing per share items: 4,955,377 5,217,242 5,470,820 5,632,685 5,582,520 -7 Closing stock price on the fiscal year end: $225.74 $154.12 $112.71 $94.35 $82.50 Financial Statements Common Size Common Base-Year Financial Ratios Type here to search % & 8 Gillian Pool & Spa Supplies Financial Statement Information Consolidated Balance Sheet In thousands oncept number of outstanding shares and rock price) ASSETS Cash and Marketable Securities $ Accounts Receivable Inventory Curent Assets Land Building Plant, and Equipmes Acoumused Depreciation Net Fred Assets $ Total Assets $ 2014 155.000001 10.000.00 250,000.00 415.000.00 2015 309,093.000 12.000.00 270.000.00 591093005 2016 75.948.000 20 000.00 500,000.00 595,948.000 2017 28,826 005 77.653.00 520,000.00 626.479.00 2018 18.425.00 30.070.00 560.000.00 668 503.00 250,000.00 $ 125,000.00 225.000.00 640,000.00 $ 250,000.00 150,000.00 200 000 00 791,099.00 500 000.00 $ (100.000.00 400,000.00 $ 935,948.00 $ 500 000.00 $ T150,000.00 350.000.000 976.479.00 $ 500,000.00 1200 000 000 300,000.00 968.503.00 $ $ LIABILITIES AND EQUITY Short-term Bank Loans Accounts Payable Accruals Current Lisbies 50,000.00 $ 10.000.00 5,000.00 65.000.000 145.000.000 10.506.00 5.100.00 160.605.00 140,000.00 $ 19.998.00 7.33100 167,329.00 148,000.00 15 995.00 9,30100 173.236.00 $ 148.000.00 15,795.00 11.626.00 178,42100 $ $ Long-term Bank Loans Mortgage Long-term Debu Total Liabilities $ $ 63,366.00 1 175,000.00 238.366.00 303.366005 98.000.000 173.000.00 271,000.00 43160600 136.000.00! 271000.00 467.000.000 634 329.00 $ 190,000.00 $ 268 000.00 458.00000 631288.00 $ 183,000.00 264,000.00 447000.00 623.42100 $ 3 Common Stock Retained Earnings TorslEquity Total Liabilities and Equity 2 320.000.000 16.634.00 33664003 640,000.00 $ $ $ 320.000.000 39,493.00 359493.00 $ 791,099.00 $ 320,000.00 25 082.00 320,000.00 41619.00 361613.000 995,948.00 # 320,000.00 25.183.00 345 183001 976.479.00 $ 968,503.00 Financial Statements Common Size Common Base-Year Financial Ratios Ready Type here to search


