Answered step by step
Verified Expert Solution
Question
1 Approved Answer
Can you do both the flowchart and code please. The 3rd picture is what the heart compliance plot should look like. The goal of this
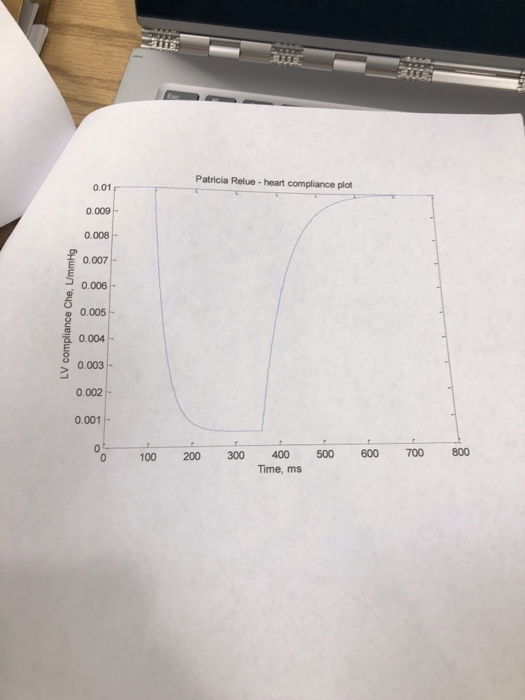
Can you do both the flowchart and code please. The 3rd picture is what the heart compliance plot should look like. 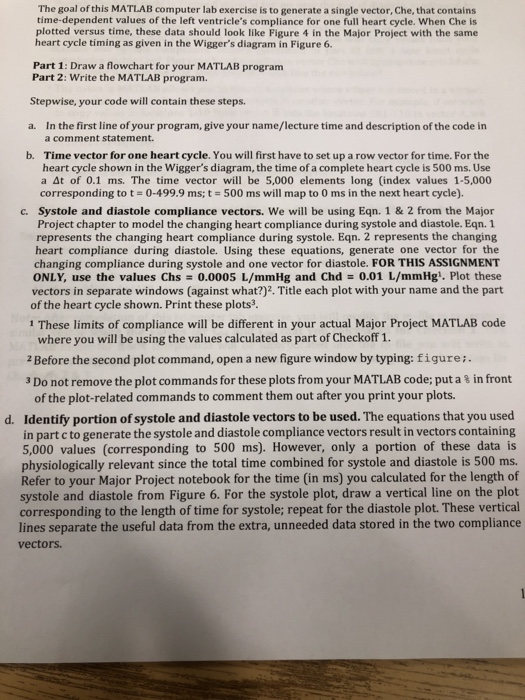
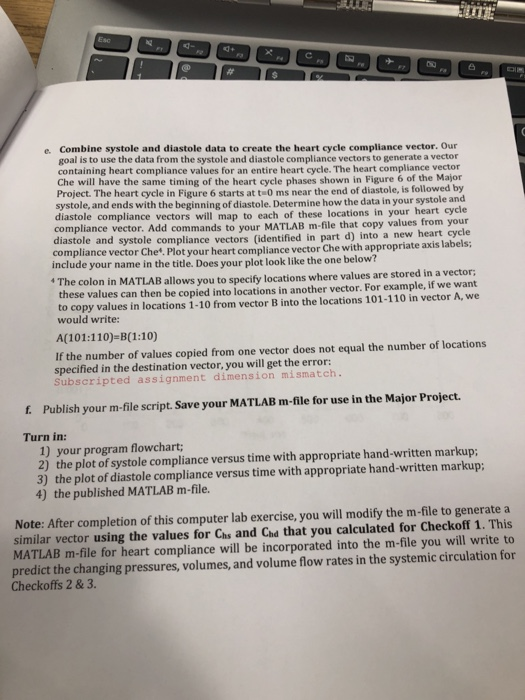
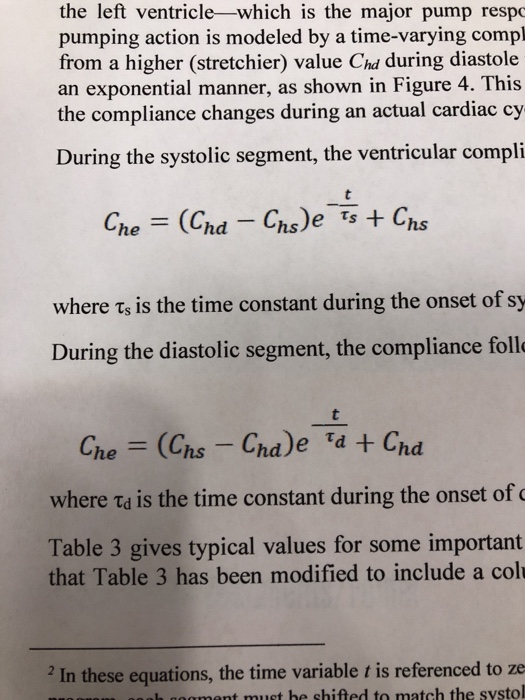
The goal of this MATLAB computer lab exercise is to generate a single vector, Che, that contains time-dependent values of the left ventricle's compliance for one full heart cycle. When Che plotted versus time, these data should look like Figure 4 in the Major Project with the same heart cycle timing as given in the Wigger's diagram in Figure 6. Part 1: Draw a flowchart for your MATLAB program Part 2: Write the MATLAB program. Stepwise, your code will contain these steps a. In the first line of your program, give your name/lecture time and description of the code in a comment statement. b. Time vector for one heart cycle. You will first have to set up a row vector for time. For the heart cycle shown in the Wigger's diagram, the time of a complete heart cycle is 500 ms. Use a At of 0.1 ms. The time vector will be 5,000 elements long (index values 1-5,000 corresponding to t 0-4999 ms; t = 500 ms will map to 0 ms in the next heart cycle). Systole and diastole compliance vectors. We will be using Eqn. 1 & 2 from the Major Project chapter to model the changing heart compliance during systole and diastole. Eqn. 1 represents the changing heart compliance during systole. Eqn. 2 represents the changing heart compliance during diastole. Using these equations, generate one vector for the changing compliance during systole and one vector for diastole. FOR THIS ASSIGNMENT ONLY, use the values Chs 0.0005 L/mmHg and Chd = 0.01 L/mmHg, Plot these vectors in separate windows (against what?)2. Title each plot with your name and the part c. of the heart cycle shown. Print these plots3 1 These limits of compliance will be different in your actual Major Project MATLAB code where you will be using the values calculated as part of Checkoff 1 2Before the second plot command, open a new figure window by typing: figure: 3 Do not remove the plot commands for these plots from your MATLAB code; put a & in front of the plot-related commands to comment them out after you print your plots d. Identify portion of systole and diastole vectors to be used. The equations that you used in part c to generate the systole and diastole compliance vectors result in vectors containing 5,000 values (corresponding to 500 ms). However, only a portion of these data is physiologically relevant since the total time combined for systole and diastole is 500 ms. Refer to your Major Project notebook for the time (in ms) you calculated for the length of systole and diastole from Figure 6. For the systole plot, draw a vertical line on the plot corresponding to the length of time for systole; repeat for the diastole plot. These vertical lines separate the useful data from the extra, unneeded data stored in the two compliance vectors 


Step by Step Solution
There are 3 Steps involved in it
Step: 1

Get Instant Access to Expert-Tailored Solutions
See step-by-step solutions with expert insights and AI powered tools for academic success
Step: 2

Step: 3

Ace Your Homework with AI
Get the answers you need in no time with our AI-driven, step-by-step assistance
Get Started


