Answered step by step
Verified Expert Solution
Link Copied!

Question

1 Approved Answer

Can you explain this Find Equations of Lines Using the TI Question 12 0 / 1 point Write the best-fit linear model for the data.

Can you explain this
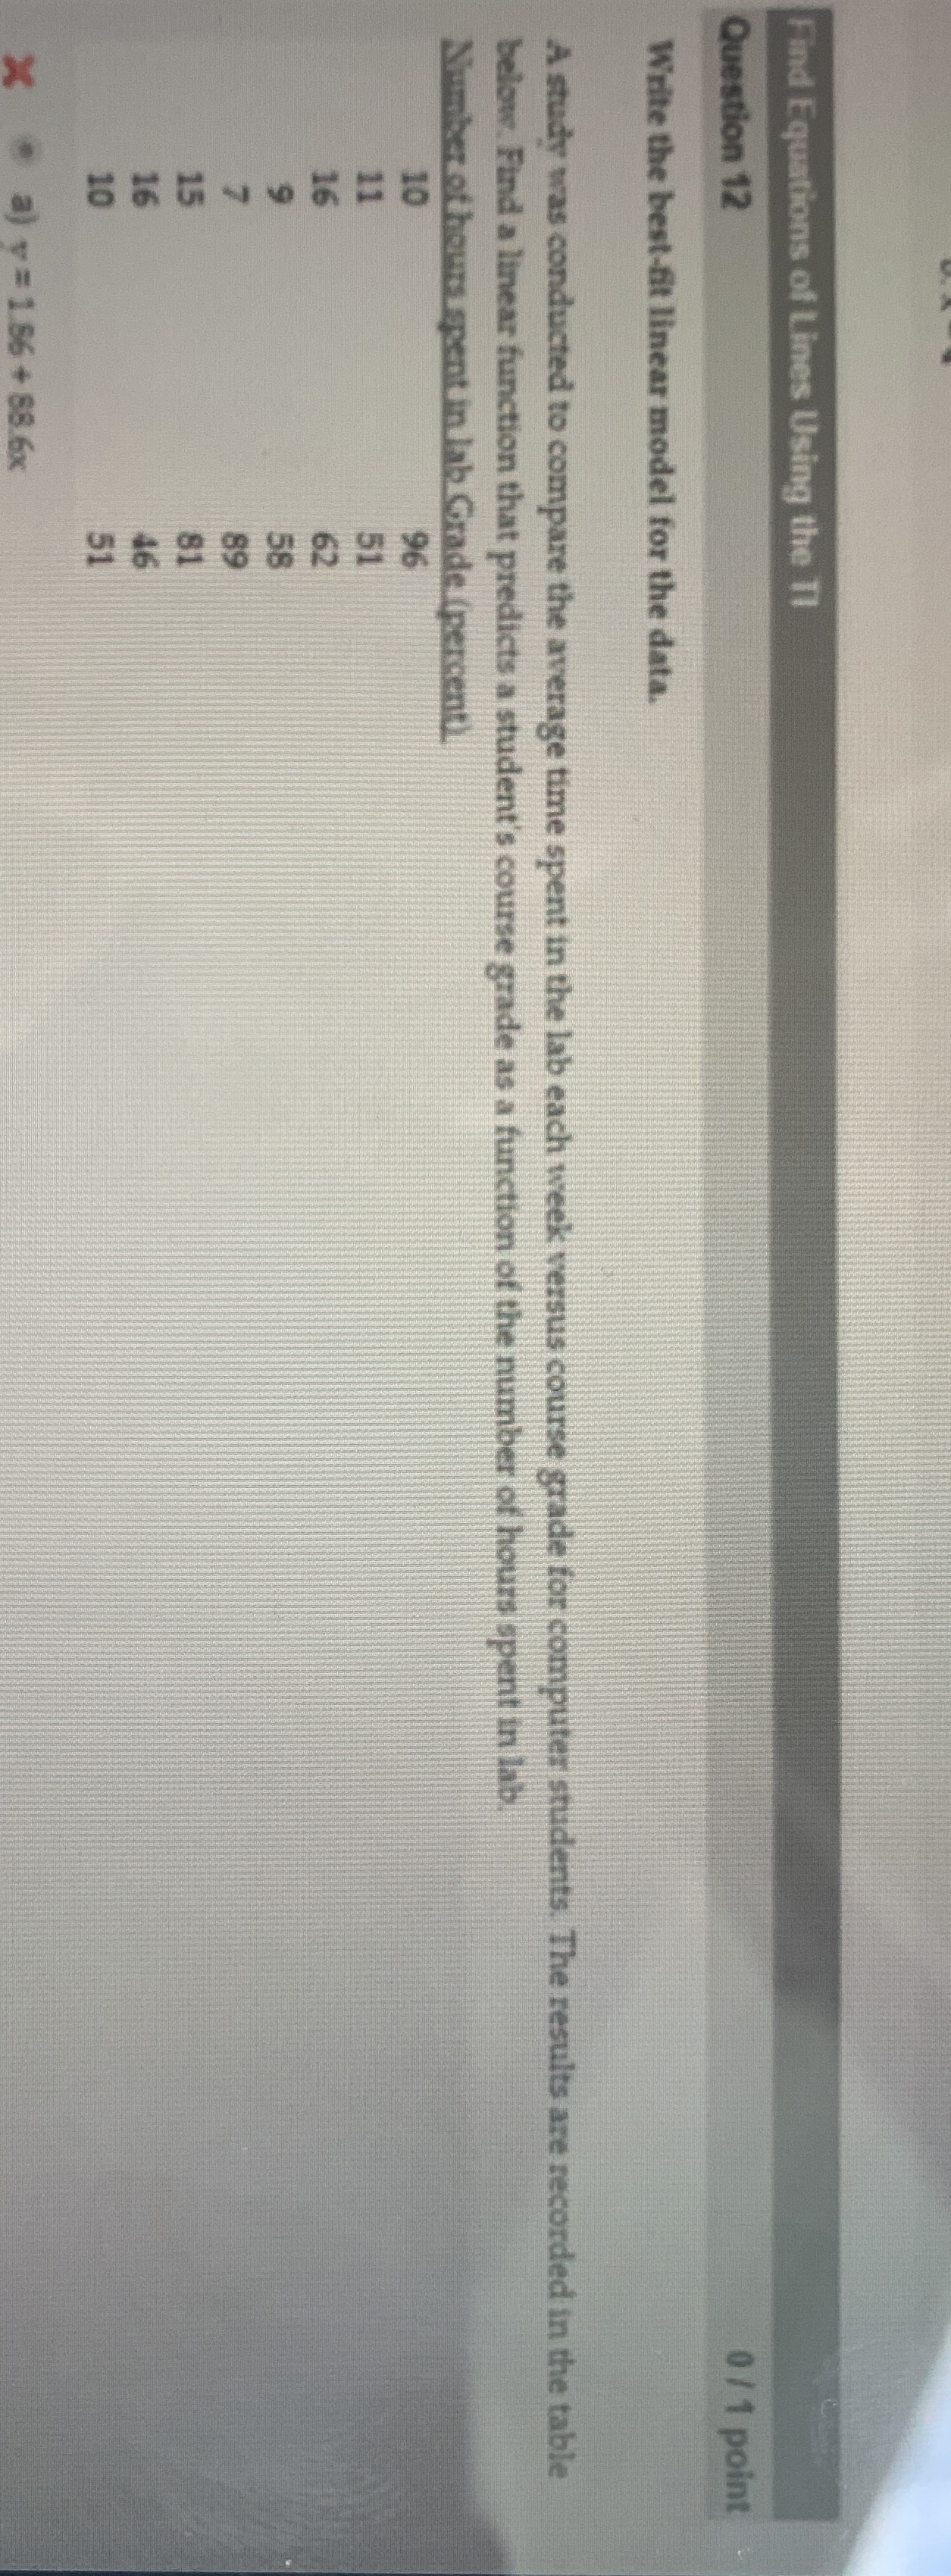
image text in transcribed
Find Equations of Lines Using the TI Question 12 0 / 1 point Write the best-fit linear model for the data. A study was conducted to compare the average time spent in the lab each week versus course grade for computer students. The results are recorded in the table below. Find a linear function that predicts a student's course grade as a function of the number of hours spent in lab Number of hours spent in lab Grade (percent) X 68.6x

Step by Step Solution

There are 3 Steps involved in it

Step: 1

blur-text-image

Get Instant Access to Expert-Tailored Solutions

See step-by-step solutions with expert insights and AI powered tools for academic success

Step: 2

blur-text-image

Step: 3

blur-text-image

Ace Your Homework with AI

Get the answers you need in no time with our AI-driven, step-by-step assistance

Get Started

Recommended Textbook for

College Algebra Graphs and Models

Authors: Marvin L. Bittinger, Judith A. Beecher, David J. Ellenbogen, Judith A. Penna

5th edition

321845404, 978-0321791009, 321791002, 978-0321783950, 321783956, 978-0321845405

More Books

Students also viewed these Mathematics questions

Question

ii) t = (y*=2) + (z=a=y); where y = 2

Answered: 1 week ago