Answered step by step
Verified Expert Solution
Link Copied!

Question

1 Approved Answer

Can you help me find the solution please thanks. Response velocity Parameter Estimates Effect Summary Multivariate Std t Ratio Prob>|t| Correlations Term Estimate Source Log

Can you help me find the solution please thanks.
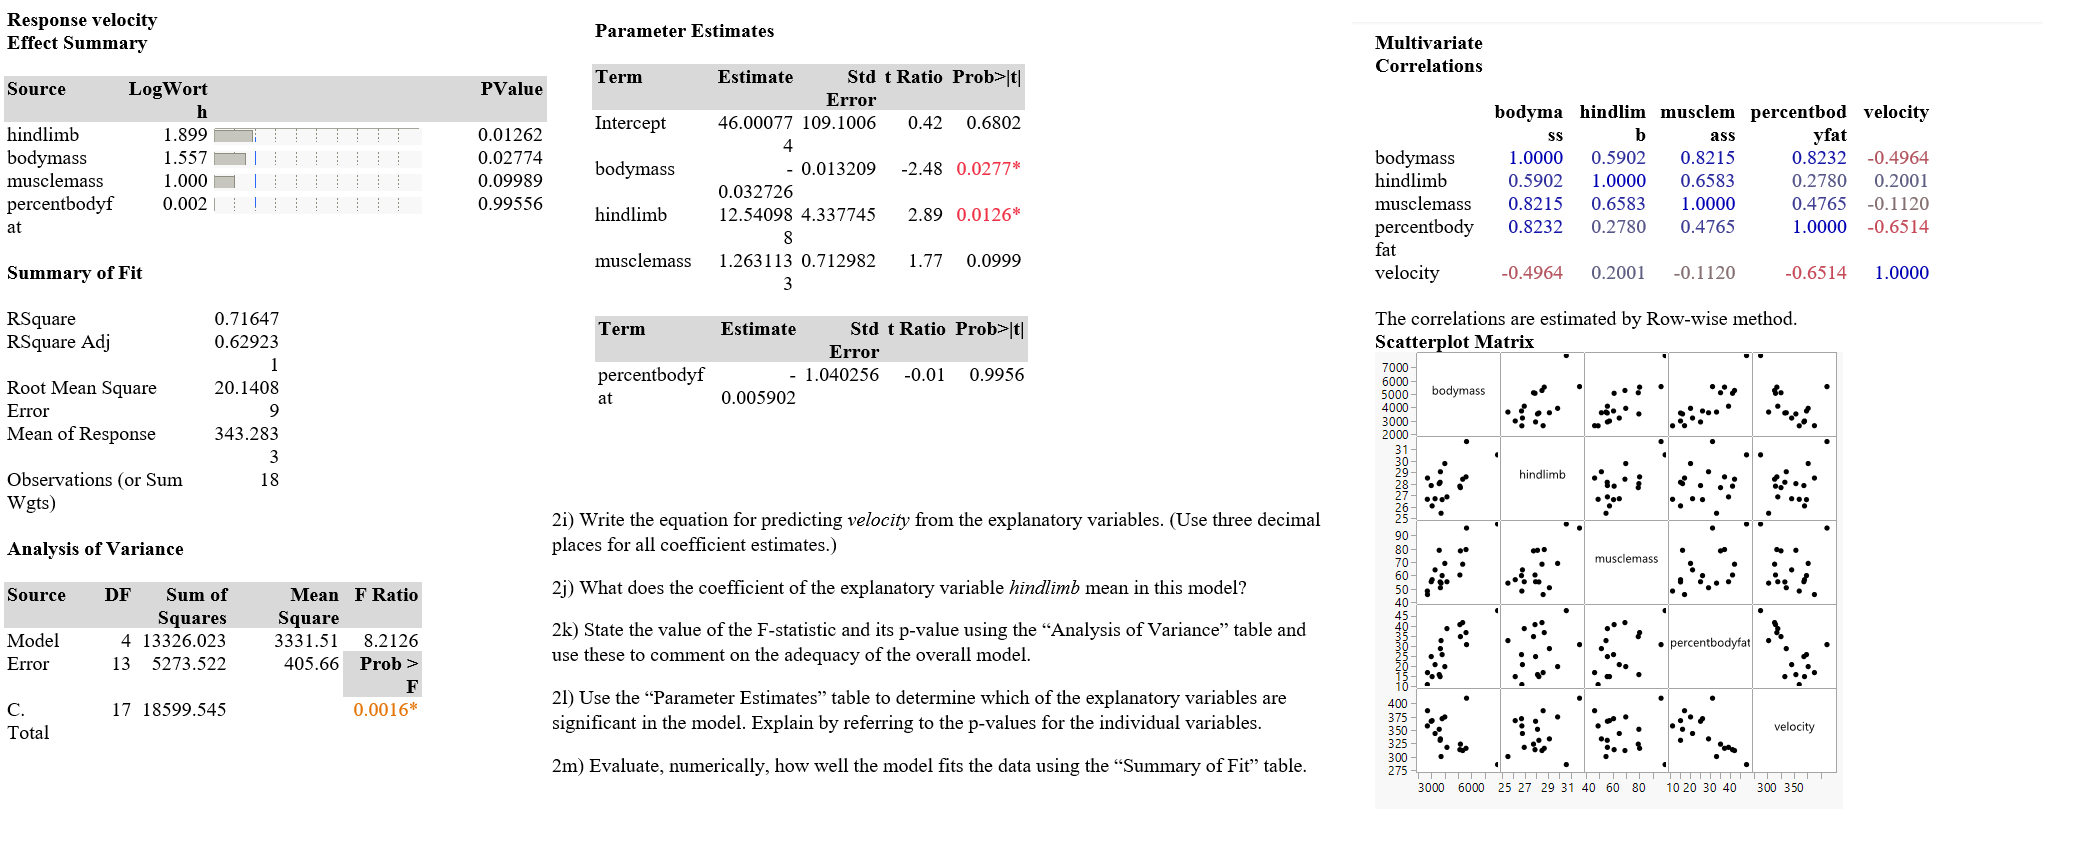
image text in transcribed
Response velocity Parameter Estimates Effect Summary Multivariate Std t Ratio Prob>|t| Correlations Term Estimate Source Log Wort PValue Error Intercept 0.42 0.6802 bodyma hindlim musclem percentbod velocity hindlimb 1.899 0.01262 46.00077 109.1006 SS b ass vfat bodymass 1.557 0.02774 0.013209 -2.48 0.0277* bodymass 1.0000 0.5902 0.8215 0.8232 0.4964 bodymass musclemass 1.000 0.09989 hindlimb 0.5902 1.0000 0.6583 0.2780 0.2001 0.032726 percentbodyf 0.002 0.99556 2.89 0.0126* musclemass 0.8215 0.6583 1.0000 0.4765 -0.1120 hindlimb 12.54098 4.337745 at percentbody 0.8232 0.2780 0.4765 1.0000 -0.6514 fat musclemass 1.263113 0.712982 1.77 0.0999 Summary of Fit velocity -0.4964 0.2001 -0.1120 -0.6514 1.0000 RSquare 0.71647 Term Estimate Std t Ratio Prob>(t) The correlations are estimated by Row-wise method. RSquare Adj 0.62923 Error Scatterplot Matrix percentbodyf 1.040256 -0.01 0.9956 7000 - 6000 - Root Mean Square 20.1408 at 0.005902 5000- bodymass Error 4000- 3000 - Mean of Response 343.283 2000 31- 3 30- Observations (or Sum 18 28- hindlimb Wgts 26- 21) Write the equation for predicting velocity from the explanatory variables. (Use three decimal 25- 90- Analysis of Variance places for all coefficient estimates.) 80- 70- musclemass 60- . . 50- Source DF Sum of Mean F Ratio 2j) What does the coefficient of the explanatory variable hindlimb mean in this model? 40- Squares Square 45- 40- Model 4 13326.023 3331.51 8.2126 2k) State the value of the F-statistic and its p-value using the "Analysis of Variance" table and 30- percentbodyfat Error 13 5273.522 405.66 Prob > use these to comment on the adequacy of the overall model. 20- C. 17 18599.545 0.0016* 21) Use the "Parameter Estimates" table to determine which of the explanatory variables are 400 Total significant in the model. Explain by referring to the p-values for the individual variables. 375 350 velocity 325 300 2m) Evaluate, numerically, how well the model fits the data using the "Summary of Fit" table. 275 TITTTTTT ITTTT 3000 6000 25 27 29 31 40 60 80 10 20 30 40 300 350

Step by Step Solution

There are 3 Steps involved in it

Step: 1

blur-text-image

Get Instant Access to Expert-Tailored Solutions

See step-by-step solutions with expert insights and AI powered tools for academic success

Step: 2

blur-text-image

Step: 3

blur-text-image

Ace Your Homework with AI

Get the answers you need in no time with our AI-driven, step-by-step assistance

Get Started

Recommended Textbook for

Algebra And Trigonometry

Authors: Cynthia Y Young

5th Edition

1119820898, 9781119820895

More Books

Students also viewed these Mathematics questions

Question

What is dividend payout ratio ?

Answered: 1 week ago

Question

Explain the factors affecting dividend policy in detail.

Answered: 1 week ago