

Question: Can you help me solve this question? The following data represent the annual revenue (in millions of dollars) for a cloud software company from 2009
Can you help me solve this question?
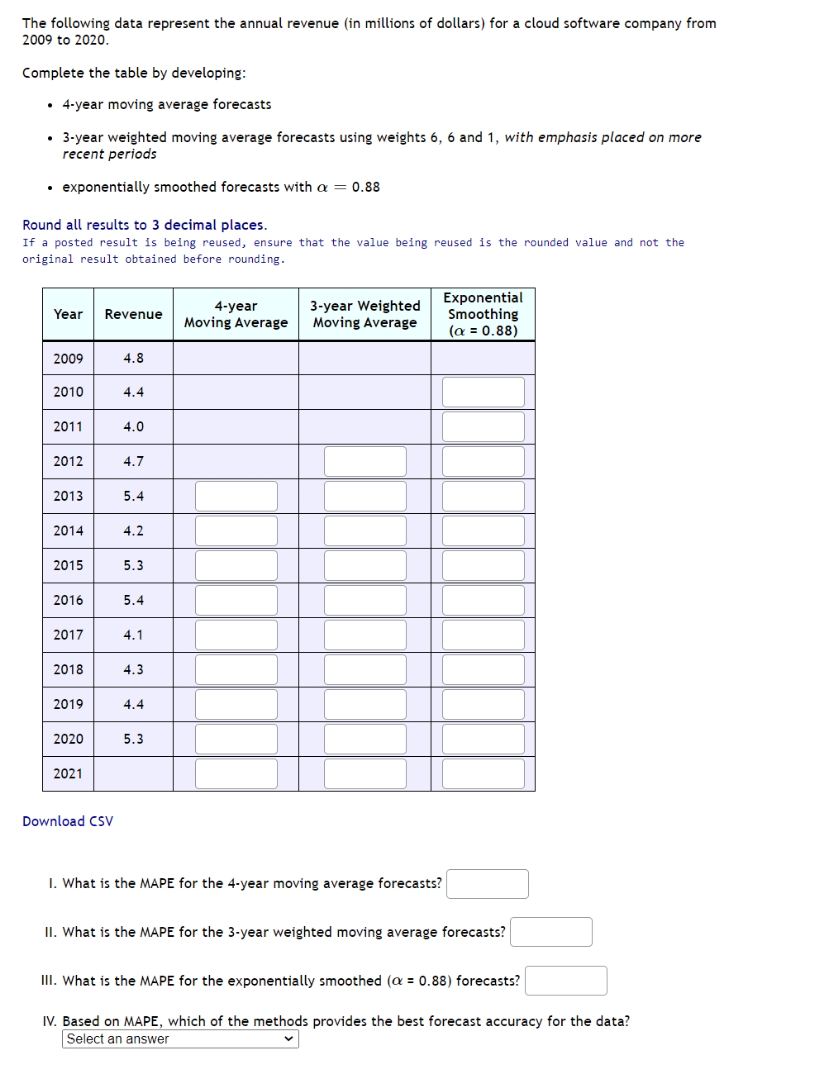
The following data represent the annual revenue (in millions of dollars) for a cloud software company from 2009 to 2020 Complete the table by developing: 4-year moving average forecasts 3-year weighted moving average forecasts using weights 6, 6 and 1, with emphasis placed on more recent periods exponentially smoothed forecasts with a = 0.88 Round all results to 3 decimal places. If a posted result is being reused, ensure that the value being reused is the rounded value and not the original result obtained before rounding. 4-year 3-year Weighted Exponential Year Revenue Moving Average Smoothing Moving Average (a = 0.88) 2009 4.8 2010 4.4 2011 4.0 2012 4.7 2013 5.4 2014 4.2 2015 5.3 2016 5.4 2017 4.1 2018 4. 3 2019 4.4 2020 5.3 2021 Download CSV 1. What is the MAPE for the 4-year moving average forecasts? Il. What is the MAPE for the 3-year weighted moving average forecasts? Ill. What is the MAPE for the exponentially smoothed (or = 0.88) forecasts? IV. Based on MAPE, which of the methods provides the best forecast accuracy for the data? Select an
Step by Step Solution
There are 3 Steps involved in it

Get step-by-step solutions from verified subject matter experts