Can you help me to solve the problem below? Thank you very much.
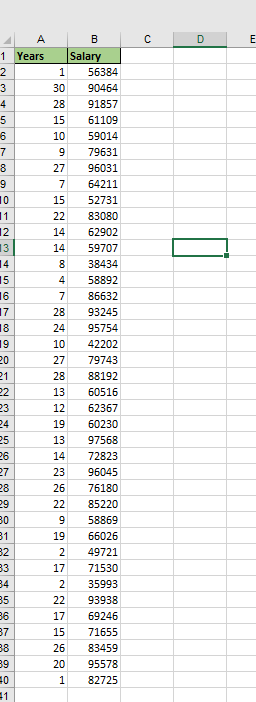
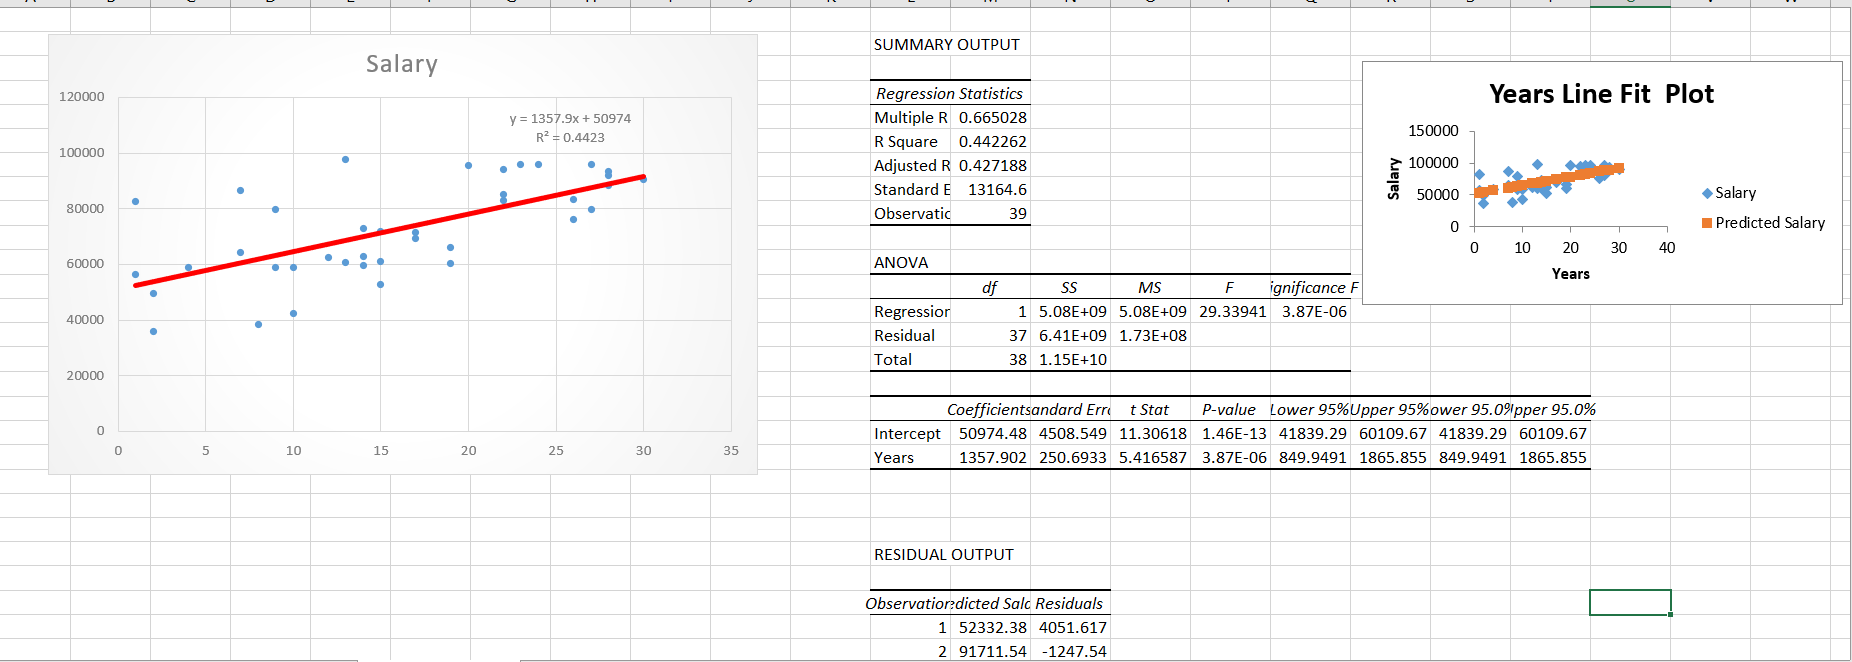
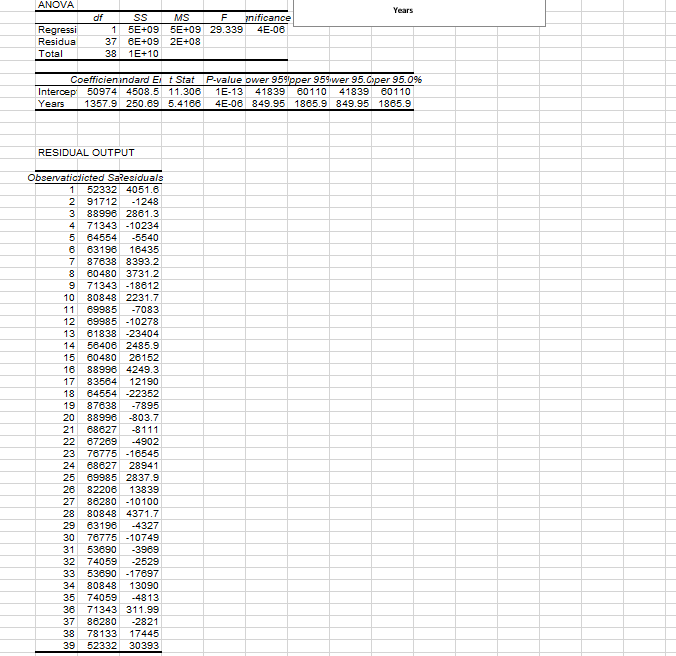
A B C D E 1 Years Salary 2 1 56384 30 90464 28 91857 15 61109 6 10 59014 9 79631 27 96031 9 7 64211 0 15 52731 22 83080 12 14 62902 3 14 59707 4 8 38434 5 A 58892 6 7 86632 7 28 93245 8 24 95754 9 10 42202 20 27 79743 21 28 88192 22 13 60516 23 12 62367 19 60230 5 13 97568 26 14 72823 27 23 96045 28 26 76180 29 22 85220 10 9 58869 31 19 66026 2 49721 17 71530 34 2 35993 35 22 93938 17 69246 7 15 71655 26 83459 19 20 95578 10 1 82725 1SUMMARY OUTPUT Salary 120000 Regression Statistics Years Line Fit Plot y = 1357.9x + 50974 Multiple R 0.665028 RZ = 0.4423 150000 R Square 0.442262 100000 Adjusted R 0.427188 100000 Salary Standard E 13164.6 50000 Salary 80000 Observatic 39 Predicted Salary 0 10 20 30 40 60000 . . ANOVA Years df SS MS F ignificance F 40000 Regression 1 5.08E+09 5.08E+09 29.33941 3.87E-06 Residual 37 6.41E+09 1.73E+08 Total 38 1.15E+10 20000 Coefficientsandard Err t Stat P-value Lower 95%Upper 95%ower 95.09pper 95.0% Intercept 50974.48 4508.549 11.30618 1.46E-13 41839.29 60109.67 41839.29 60109.67 5 10 15 20 25 30 35 Years 1357.902 250.6933 5.416587 3.87E-06 849.9491 1865.855 849.9491 1865.855 RESIDUAL OUTPUT Observation dicted Salo Residuals 1 52332.38 4051.617 2 91711.54 -1247.54ANOVA Years SS MS F Manmicance Regressi 5E+09 5E+09 29.339 4E-06 Residue 37 6E+09 2E+08 Total 38 18+10 Coefficientindard El t Stat P-value ower 959pper 959wer 95. Oper 95.0% Intercep 50974 4508.5 11.306 1E-13 41839 80110 41839 60110 Years 1357.9 250.89 5.4188 4E-06 849.95 1865.9 849.95 1865.9 RESIDUAL OUTPUT Observaticlicted SaResiduals 52332 4051.6 91712 -1248 88998 2861.3 4 71343 -10234 64554 -5540 6 63198 18435 7 87638 8393.2 80480 3731.2 71343 -18612 10 80848 2231.7 11 89985 -7083 12 89985 -10278 13 81838 -23404 14 58406 2485.9 15 80480 26152 16 88998 4249.3 17 83564 12190 18 64554 22352 19 87838 -7895 20 88998 -803.7 21 68627 -8111 22 67269 -4902 23 78775 -16545 24 88627 28941 25 89985 2837.9 26 82206 13839 27 86280 -10100 28 80848 4371.7 29 63198 -4327 30 76775 -10749 31 53890 -3989 32 74059 -2529 33 53690 -17697 34 80848 13090 35 74059 -4813 36 71343 311.99 37 86280 -2821 38 78133 17445 39 52332 30393Question: 1. What is the strength of the correlation between the year [independent variable] and salary (dependent variable]? 2. Explain what the trend line means. 3. Is there a significant relationship between your independent and dependent variables? 4. What is the probability that the value of the coefficient is obtained by chance? 5. What is your regression equation? 6. What is the Salary of an employee given 5 years' experience


