

Question: can you please answer these pleassseeeeee. Print Reset EXPLORATION 5.2: Is Yawning Contagious? | 123 STEP 3: Explore the data. 10. Calculate the conditional proportion
can you please answer these pleassseeeeee.
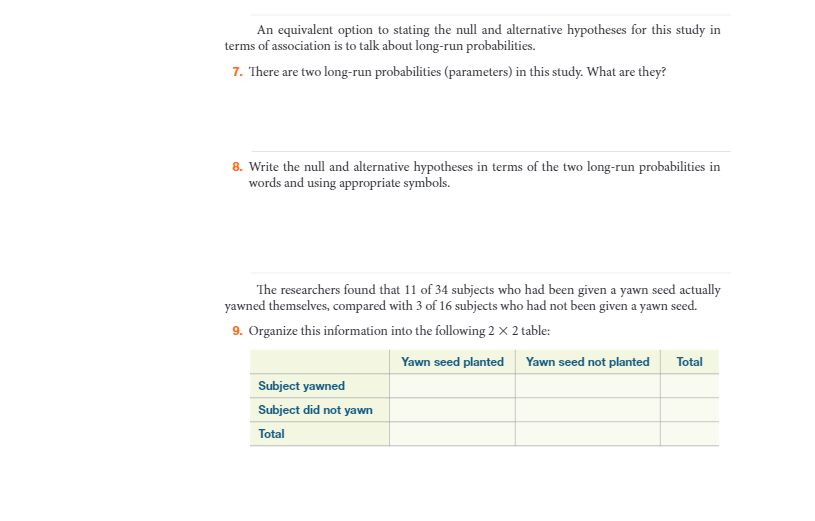
Print Reset EXPLORATION 5.2: Is Yawning Contagious? | 123 STEP 3: Explore the data. 10. Calculate the conditional proportion of subjects who yawned in the "yawn seed" group, and then do the same for the control group. Then calculate the difference between these proportions, subtracting in the direction indicated below. Proportion who yawned in "yawn seed" group: Proportion who yawned in control group: Difference in conditional proportions ("yawn seed" - control): Notice that the difference in conditional proportions is the statistic of interest now that we are comparing two groups. 11. Produce a segmented bar graph to compare the distributions of whether or not the subject yawned between the treatment (yawn seed) and control group. 12. Comment on what the graph and calculations reveal about the research question. a. Did a larger proportion of subjects yawn who were exposed to the yawn seed, as compared to the control group? b. Based on your analysis thus far, do you think these data provide much evidence that yawning is contagious? Explain. STEP 4: Draw inferences beyond the data. We see that the proportion of subjects in the "yawn seed" group who yawned was greater than the proportion who yawned in the con- trol group. But does this provide convincing evidence of a genuine difference in the long-run probabilities? To determine whether the Myth Busters results provide convincing evidence that yawning is contagious, we will apply the same logic that we have used previously: We will use a simulation analysis to determine whether their results are typical or surprising for what we would find if yawning is not contagious. 13. As with earlier studies, there are two possible explanations for the MythBusters results. What are they? (Hint: These correspond to the null and alternative hypotheses stated earlier.)Print Reset 124 CHAPTER 5 Comparing Two Proportions The key to our simulation analysis is to assume that if yawning is not contagious (null hypothesis), then the 14 yawners would have yawned regardless of whether or not they had seen the yawn seed. Similarly, we'll assume that the 36 nonyawners would not have yawned, no matter which group they had been assigned. In other words, our simulation assumes the null hypothesis is true-that there is no association, no connection, between the yawn seed and actual yawning. KEY IDEA To evaluate the statistical significance of the observed difference in our groups, we will investigate how large the difference in conditional proportions tends to be just from the random assignment of response outcomes to the explanatory variable groups. We cannot use coins to conduct this simulation analysis, because we have two variables to consider: whether or not the yawn seed was planted and whether or not the subject yawned. Instead of coins, we will use index cards. Here's our strategy: Take a set of 50 cards, with 14 blue cards (to represent the yawners) and 36 green cards (to represent those who did not yawn). . Shuffle the cards well and randomly deal out 34 to be the yawn seed group (the rest go to the control group). . Count how many yawners (blue cards) you have in each group and how many nonyawn- ers (green cards) you have in each group. . Construct the two-way table to show the number of yawners and nonyawners in each group. (Clearly nothing different happened to those in Group A and those in Group B- any differences between the two groups that arise are due purely to the random assign- ment process.) 14. Do this shuffling and dealing once. a. Report the (simulated) 2 x 2 table that your shuffling and dealing produces: Yawn seed Yawn seed not planted Total planted Subject yawned 14 Subject did not yawn 36 Total 34 16 50 b. Calculate the conditional proportions who yawned for your simulated data and the difference in those proportions: (Simulated) Proportion who yawned in treatment group: (Simulated) Proportion who yawned in control group: (Simulated) Difference in conditional proportions (treatment - control):Print Reset EXPLORATION 5.2: Is Yawning Contagious? | 125 c. Is your simulated statistic (difference in conditional proportions) at least as large as the observed value of the statistic from the Myth Busters study? We need to perform a large number of repetitions (say, 1,000 or more) in order to assess whether the MythBusters result is typical or surprising when yawning is not contagious. To do this we will use an applet specifically designed for this purpose: the Two Proportions applet. 15. Open this applet and verify the two-way table, segmented bar graph, and observed differ- ence in simulated proportions you found above. a. Check the Show Shuffle Options box. Notice how the cards have been set up: 14 blue cards, with 11 in the yawners group. Press Shuffle to shuffle the cards and redistribute them to the two groups. How many yawners ended up in the seeded group? What is the corresponding difference in the conditional proportions for the shuffled data? b. Press the Shuffle button four more times. Record the difference in proportions each time. Was it always the same number? Notice that each of these values has been added to the dotplot on the right. (Technical detail: In this case, it's equivalent to looking at the number of blue cards in the yawn group or the difference in conditional proportions as the statistic of interest.) 16. Use this applet to conduct 1,000 repetitions of this simulation: Change the Number of Shuffles from 1 to 995 (for a total of 1,000) and press Shuffle. The applet produces a dotplot showing the null distribution for the difference in proportions of yawners between the two groups. Map this simulation to the research study: Null hypothesis One repetition Statistic 17. Look more closely at the simulated null distribution for the difference in proportions of yawners between the two groups. a. Is this null distribution centered around 0? Explain why this makes sense. (Hint: Think about the choice of statistic and about the null hypothesis, which was the basis of the simulation analysis.)Print Reset 126 CHAPTER 5 Comparing Two Proportions b. Is the observed value of the statistic from the MythBusters study (0.136) out in the tail of this null distribution or not so much? In other words, does the observed result appear to be typical or surprising when the null hypothesis (that yawning is not conta- gious) is true? C. As you know, you can assess the strength of evidence against the null hypothesis by calculating a p-value. To calculate a p-value from this null distribution, you will count the number of repetitions that produced a simulated difference in proportions equal to or (choose more or less). 18. Enter the observed difference in the sample proportions in the Count Samples box and choose the direction from the pull-down menu and press Count. Check whether the shaded region of the dotplot corresponds with your answer to #17c. Then report this approximate p-value. 19. Interpret this p-value by filling in the following blanks: Under the assumption that , if we repeatedly many, many times, the probability we would obtain a difference in conditional proportions as or more extreme than is aboutAn equivalent option to stating the null and alternative hypotheses for this study in terms of association is to talk about long-run probabilities. 7. There are two long-run probabilities (parameters) in this study. What are they? 8. Write the null and alternative hypotheses in terms of the two long-run probabilities in words and using appropriate symbols. The researchers found that 11 of 34 subjects who had been given a yawn seed actually yawned themselves, compared with 3 of 16 subjects who had not been given a yawn seed. 9. Organize this information into the following 2 X 2 table: Yawn seed planted Yawn seed not planted Total Subject yawned Subject did not yawn Total
Step by Step Solution
There are 3 Steps involved in it

Get step-by-step solutions from verified subject matter experts