Answered step by step
Verified Expert Solution
Question
1 Approved Answer
Can you please do Comment on Correlation part please. it is in the first pic. DVN MRO LUV NVDA UAL 0.000401921 0.000336540 0.000888784 0.002125680 0.000793921
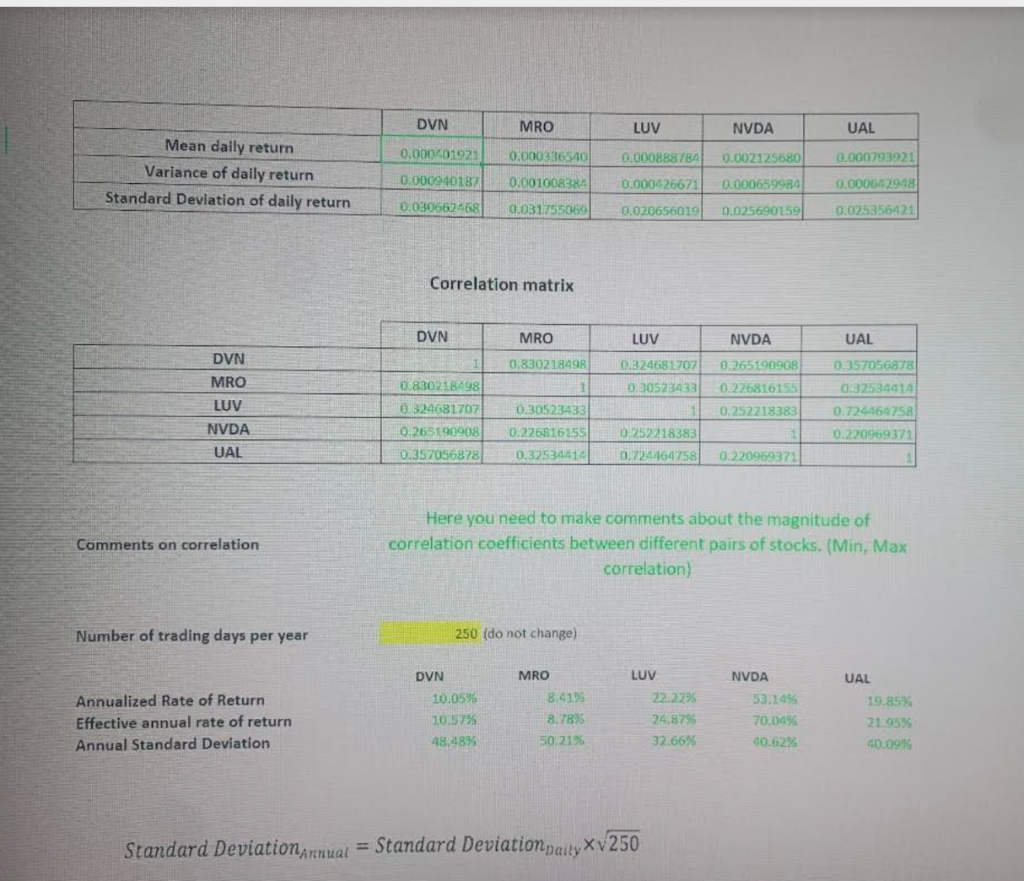
Can you please do Comment on Correlation part please. it is in the first pic.
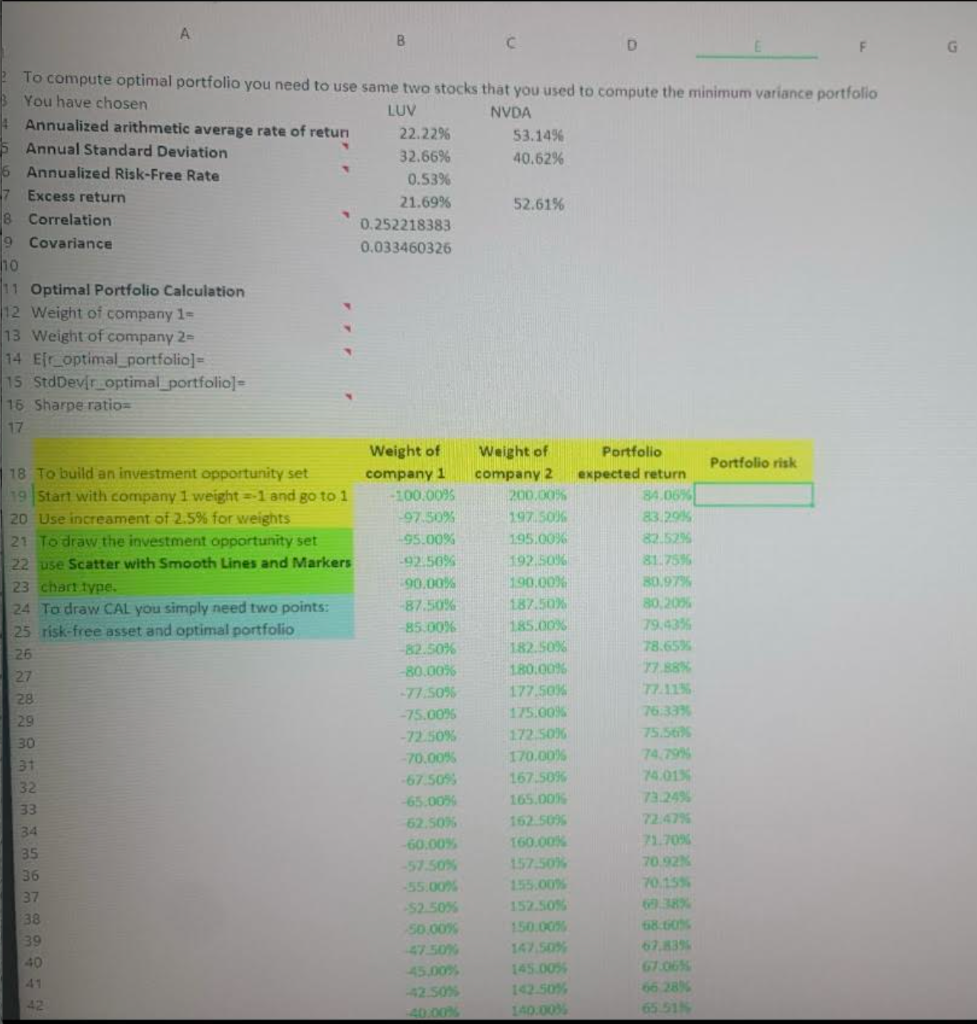
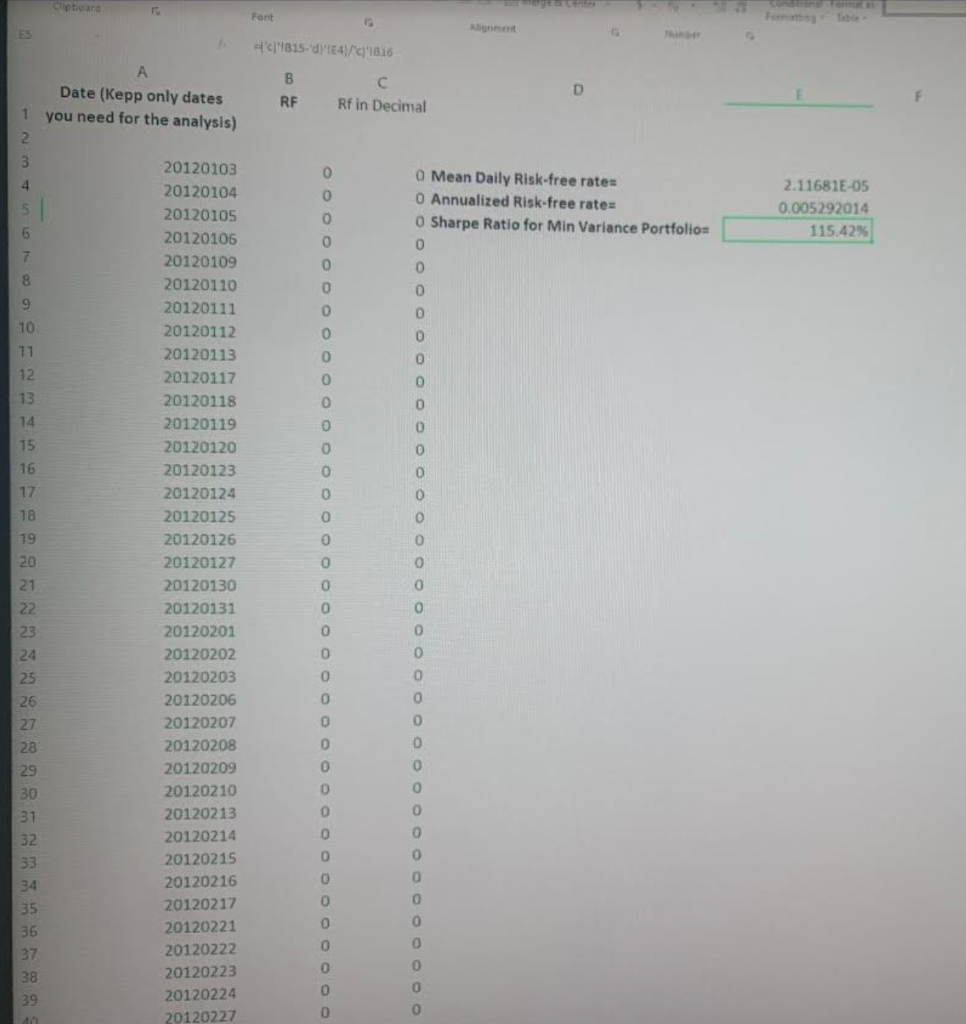
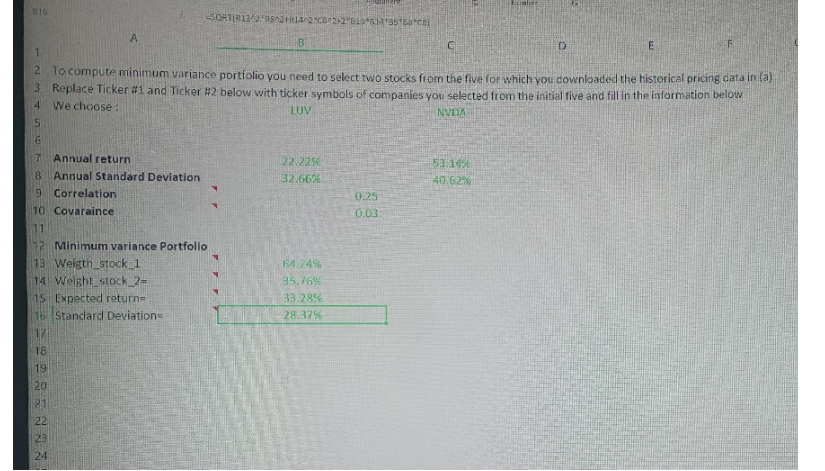
DVN MRO LUV NVDA UAL 0.000401921 0.000336540 0.000888784 0.002125680 0.000793921 Mean daily return Variance of daily return Standard Deviation of daily return 0.000940187 0.001008384 0.000659984 0.000642948 0.000426671 0.020656019 0.030662468 0.031755069 0.025690159 0.025356421 Correlation matrix DVN MRO LUV NVDA UAL DVN 0.830218498 0.265190908 MRO 0324681707 0.30523433 0.226816155 0.252218383 LUV NVDA UAL 0.830218498 0.324681707 0.265190908 0.357056878 0.357056878 0.32534414 0.724164758 0.220969371 0.30523433 0.225816155 0.32534414 0252218383 0.724464758 0.220969371 Comments on correlation Here you need to make comments about the magnitude of correlation coefficients between different pairs of stocks. (Min, Max correlation) Number of trading days per year 250 (do not change) MRO LUV NVDA Annualized Rate of Return Effective annual rate of return Annual Standard Deviation DVN 10.0596 1057% 48,48% 8.419 8.7895 50.215 22.22% 24.8795 32.66% 53.14% 70.04% 90.62% UAL 19.85% 21.955 40.09% Standard Deviation annual = Standard Deviation paily XV 250 B D F To compute optimal portfolio you need to use same two stocks that you used to compute the minimum variance portfolio You have chosen LUV Annualized arithmetic average rate of retun NVDA 22.22% 53.1496 5 Annual Standard Deviation 32.66% 40.62% 6 Annualized Risk-Free Rate 0.53% 7 Excess return 21.69% 52.61% 8 Correlation 0.252218383 9 Covariance 0.033460326 no 11 Optimal Portfolio Calculation 12 Weight of company 1- 13 Weight of company 2- 14 Eid_optimal portfolio)= 15 StdDevir optimal_portfolio] - 16 Sharpe ration 17 Weight of Weight of Portfolio 18 To build an investment opportunity set lio risk company 1 company 2 expected return 19 Start with company 1 weight =-1 and go to 1 -100.0095 200.00% 84.06% 20 Use increament of 2.5% for weights 97.50% 197506 83.29 21 To draw the investment opportunity set 95.00% 195.00% 82.5255 22 use Scatter with Smooth Lines and Markers L92 50% 192 50% 81.75% 23 chart type. 90.00% 190.00% 30.97% 24 To draw CAL you simply need two points: -87.50% 187.50% 80.2015 25 risk-free asset and optimal portfolio 85.00% 185.00% 79.4375 26 82.50% 182.50 78.65 27 80.00% 180.00% 77.88% 28 -77.50% 177.50% 77.115 29 -75.00% 175.00% 763339 30 -72 50% 172 50% 75.56) - 70.00% 31 170,00% 74.799 32 -67 509 167509 74.015 -65.00% 33 165.00 73249 62.50% 162.5095 34 22.4235 60.00% 35 160.00% 1.709 57.50 157-50% 70.92 36 37 55.00 15.00 70.155 $2.50% 152.SOS 38 50.00% 150.00 58 39 37507 147.50 67.839 40 45.00 145.00 -42.50% 102.50% 5628 42 40.00 140.00 Clipboard Fant -C815-d/14/1816 A Date (Kepp only dates 1 you need for the analysis) B RF Rf in Decimal D 3 0 4 0 5 O Mean Daily Risk-free rates O Annualized Risk-free rate- O Sharpe Ratio for Min Variance Portfolios 0 2.11681E-05 0.005292014 115.42% 6 0 0 0 0 7 8 9 10 0 0 O 0 0 O 71 0 0 12 O O O 13 14 0 O 0 O 0 O 15 16 17 18 0 O 0 0 0 79 0 0 20120103 20120104 20120105 20120106 20120109 20120110 20120111 20120112 20120113 20120117 20120118 20120119 20120120 20120123 20120124 20120125 20120126 20120127 20120130 20120131 20120201 20120202 20120203 20120206 20120207 20120208 20120209 20120210 20120213 20120214 20120215 20120216 20120217 20120221 20120222 20120223 20120224 20120227 o 0 0 0 O O 0 0 0 O 0 O 20 21 22 23 24 25 26 27 28 29 30 31 32 33 34 35 36 37 38 39 O 0 0 O 0 0 O 0 0 0 0 0 O 0 0 0 0 0 0 0 0 0 O 0 3:16 SORTB13222082-2B1351439 LACH B C D E 1 2. To compute minimum variance portfolio you need to select two stocks from the five for which you cownloaded the historical pricing data in la) 3 Replace Ticker #1 and Ticker #2 below with ticker symbols of companies you selected from the initial tive and fill in the information below 4 We choose: LUV NUDA 5 6 7 Annual return 22.225 53:14 8 Annual Standard Deviation 32.66% 40.62% 9 Correlation 0.25 10 Covaraince 0.03 64.24% 35.76% 33.28% 28.37% 12 Minimum variance Portfolio 13 Weigth_stock_1 14 Weight_stock_2= 15 Expected return= 16 Standard Deviations 17 18 19 20 21 22 24
Step by Step Solution
There are 3 Steps involved in it
Step: 1

Get Instant Access to Expert-Tailored Solutions
See step-by-step solutions with expert insights and AI powered tools for academic success
Step: 2

Step: 3

Ace Your Homework with AI
Get the answers you need in no time with our AI-driven, step-by-step assistance
Get Started


