Can you please help solving with details breakdown?
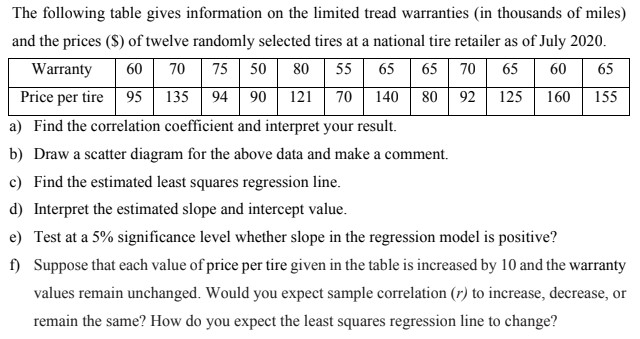
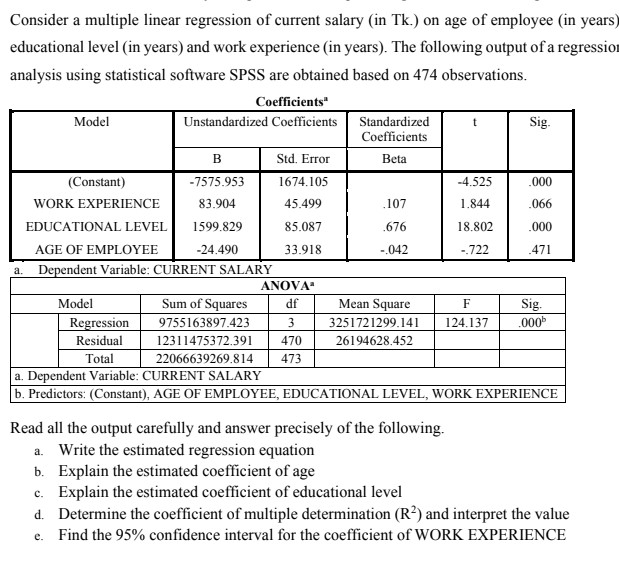
The following table gives information on the limited tread warranties (in thousands of miles) and the prices ($) of twelve randomly selected tires at a national tire retailer as of July 2020. Warranty 60 70 75 50 80 55 65 65 70 65 60 65 Price per tire 95 135 94 90 121 70 140 80 92 125 160 155 a) Find the correlation coefficient and interpret your result. b) Draw a scatter diagram for the above data and make a comment. c) Find the estimated least squares regression line. d) Interpret the estimated slope and intercept value. e) Test at a 5% significance level whether slope in the regression model is positive? f) Suppose that each value of price per tire given in the table is increased by 10 and the warranty values remain unchanged. Would you expect sample correlation (r) to increase, decrease, or remain the same? How do you expect the least squares regression line to change?Consider a multiple linear regression of current salary (in Tk.) on age of employee (in years) educational level (in years) and work experience (in years). The following output of a regression analysis using statistical software SPSS are obtained based on 474 observations. Coefficients" Model Unstandardized Coefficients Standardized Sig Coefficients B Std. Error Beta (Constant) -7575.953 1674.105 -4.525 000 WORK EXPERIENCE 83.904 45.499 107 1.844 .066 EDUCATIONAL LEVEL 1599.829 85.087 .676 18.802 .000 AGE OF EMPLOYEE -24.490 33.918 -.042 -.722 471 Dependent Variable: CURRENT SALARY ANOVA Model Sum of Squares df Mean Square F Sig. Regression 9755163897.423 3 3251721299.141 124.137 000 Residual 12311475372.391 470 26194628.452 Total 22066639269.814 473 a. Dependent Variable: CURRENT SALARY b. Predictors: (Constant), AGE OF EMPLOYEE, EDUCATIONAL LEVEL, WORK EXPERIENCE Read all the output carefully and answer precisely of the following. a. Write the estimated regression equation b. Explain the estimated coefficient of age c. Explain the estimated coefficient of educational level d. Determine the coefficient of multiple determination (R2) and interpret the value e. Find the 95% confidence interval for the coefficient of WORK EXPERIENCE