Answered step by step
Verified Expert Solution
Question
1 Approved Answer
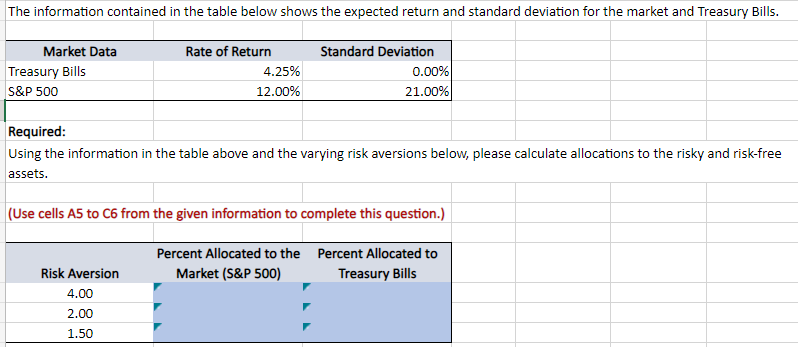
Can you please provide the formula for how to solve this. Can you show the actual calculation so I can understand it. The information contained
Can you please provide the formula for how to solve this. Can you show the actual calculation so I can understand it.
 The information contained in the table below shows the expected return and standard deviation for the market and Treasury Bills. \begin{tabular}{|l|r|r|} \hline \multicolumn{1}{|c|}{ Market Data } & Rate of Return & Standard Deviation \\ \hline Treasury Bills & 4.25% & 0.00% \\ \hline S\&P 500 & 12.00% & 21.00% \\ \hline & & \\ \hline Required: & & \\ \hline \end{tabular} Using the information in the table above and the varying risk aversions below, please calculate allocations to the risky and risk-free assets. (Use cells A5 to C6 from the given information to complete this question.)
 Step by Step Solution
There are 3 Steps involved in it
Step: 1

Get Instant Access to Expert-Tailored Solutions
See step-by-step solutions with expert insights and AI powered tools for academic success
Step: 2

Step: 3

Ace Your Homework with AI
Get the answers you need in no time with our AI-driven, step-by-step assistance
Get Started


