Can you please show me how I can solve this problem and show all the steps? Like the formulas to use in excel, etc. Please use excel to show all the work I have to solve more problems like this.


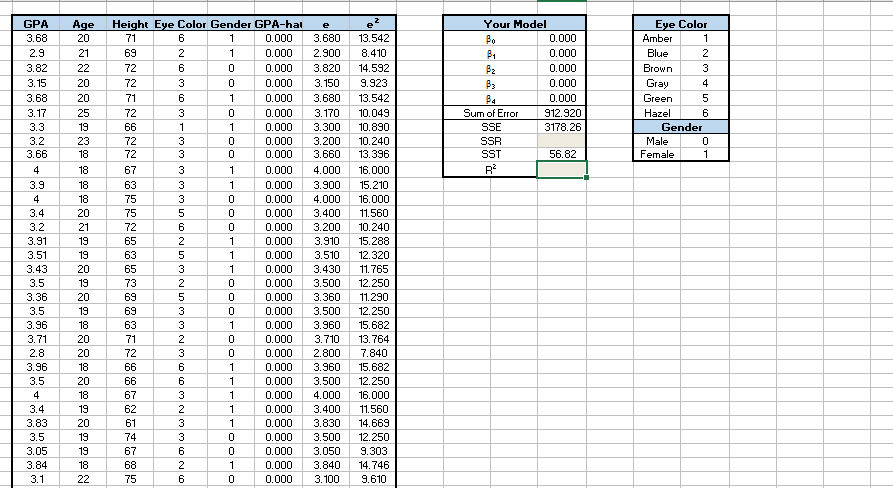
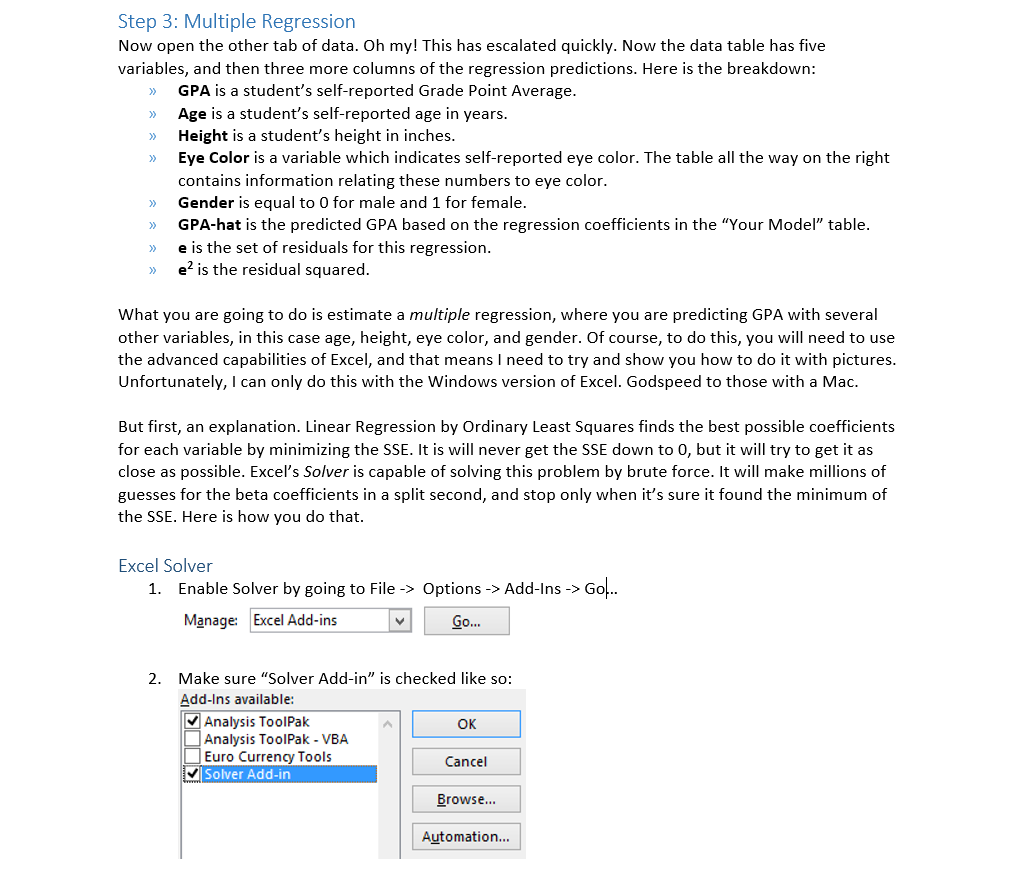
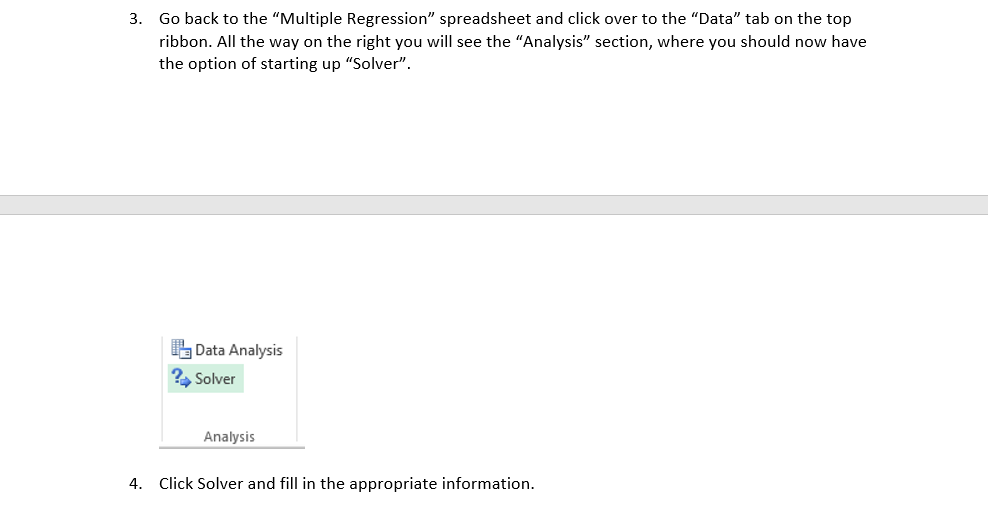
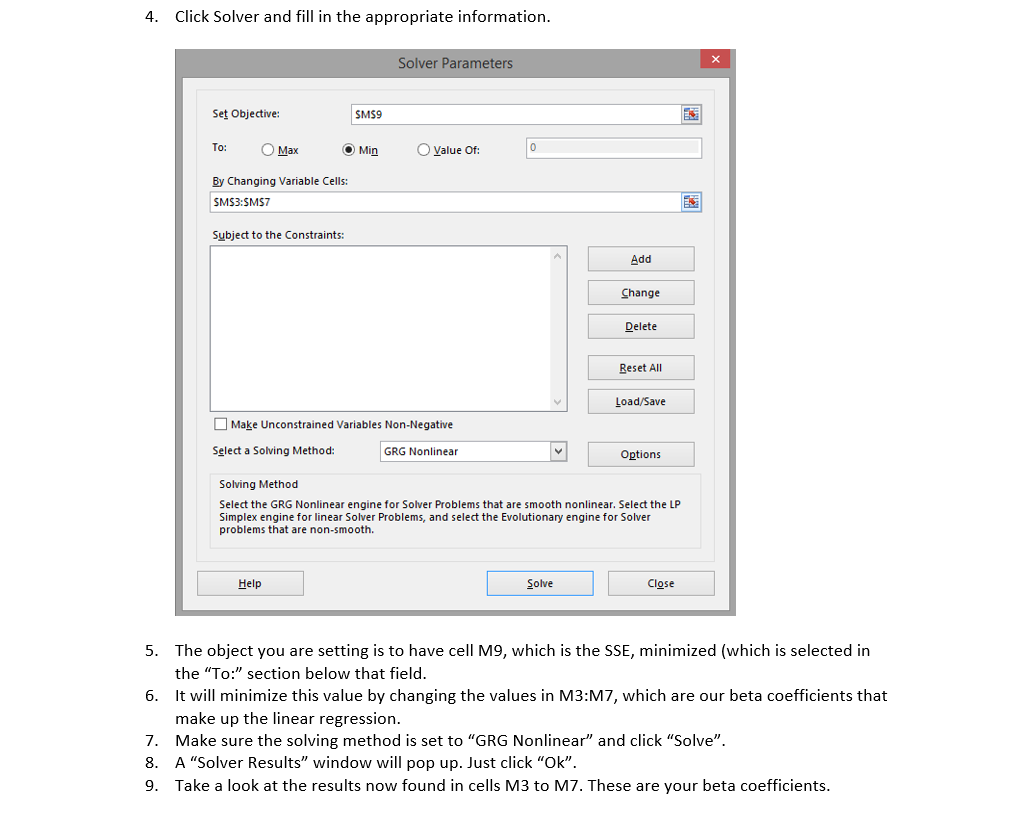
1 2 3 4 5 6 e-13 8 14 9. 13 10 10 10 13 16 15 16 11. 10 15 12 12 11. 12 15 13 7-15 12 16 11. 14 12 9. 14 9. 50 80 70 0 0 0 0 0 0 0 0 10 10 3 0 0 0 0 10 0 0 0 0 0 0 0 323333333 4 3 4 3 3 3 333333 3233 4 3 33333 P-00000000000000000000000000000000 C6263631333335 625-325 3323663233626 20 21 22 20 20 25 19 23 18 18 18 18 20 21 19 19 20 19 20 19 18 20 20 18 20 18 19 20 19 19 18 22 A 68 .9 82 15 68 17 3 .2 66 .9 + 4 .2 31 51 43 .5 36 .5 96 71 .8 96 .5 + .4 83 .5 05 3 23 3333 3 Step 3: Multiple Regression Now open the other tab of data. Oh my! This has escalated quickly. Now the data table has five variables, and then three more columns of the regression predictions. Here is the breakdown: GPA is a student's self-reported Grade Point Average Age is a student's self-reported age in years Height is a student's height in inches Eye Color is a variable which indicates self-reported eye color. The table all the way on the right contains information relating these numbers to eye color Gender is equal to O for male and 1 for female GPA-hat is the predicted GPA based on the regression coefficients in the "Your Model" table e is the set of residuals for this regression e is the residual squared What you are going to do is estimate a multiple regression, where you are predicting GPA with several other variables, in this case age, height, eye color, and gender. Of course, to do this, you will need to use the advanced capabilities of Excel, and that means I need to try and show you how to do it with pictures Unfortunately, I can only do this with the Windows version of Excel. Godspeed to those with a Mac But first, an explanation. Linear Regression by Ordinary Least Squares finds the best possible coefficients for each variable by minimizing the SSE. It is will never get the SSE down to 0, but it will try to get it as close as possible. Excel's Solver is capable of solving this problem by brute force. It will make millions of guesses for the beta coefficients in a split second, and stop only when it's sure it found the minimum of the SSE. Here is how you do that Excel Solver 1. Enable Solver by going to File -> Options->Add-Ins -> Go... Manage Excel Add-ins Go 2. Make sure "Solver Add-in" is checked like so: Add-Ins available: Analysis ToolPak Analysis ToolPak-VBA Euro Currency Tools Solver Add-in Cancel Browse... Automation... Go back to the "Multiple Regression" spreadsheet and click over to the "Data" tab on the top ribbon. All the way on the right you will see the "Analysis" section, where you should now have the option of starting up "Solver" 3. Data Analysis 2, Solver Analysis 4. Click Solver and fill in the appropriate information 4. Click Solver and fill in the appropriate information Solver Parameters Set Objective To: O Max By Changing Variable Cells: SMS9 OMinOValue Of SMS3:SMS7 Subject to the Constraints: Add Change Delete Reset All Load/Save Make unconstrained Variables Non-Negative Select a Soving Method: GRG Nonlinear Options Solving Method Select the GRG Nonlinear engine for Solver Problems that are smooth nonlinear. Select the LFP Simplex engine for linear Solver Problems, and select the Evolutionary engine for Solver problems that are non-smooth. Solve Close The object you are setting is to have cell M9, which is the SSE, minimized (which is selected in the "To:" section below that field It will minimize this value by changing the values in M3:M7, which are our beta coefficients that make up the linear regression. Make sure the solving method is set to "GRG Nonlinear" and click "Solve". A "Solver Results" window will pop up. Just click "Ok". Take a look at the results now found in cells M3 to M7. These are your beta coefficients 5. 6. 7. 8. 9. 1 2 3 4 5 6 e-13 8 14 9. 13 10 10 10 13 16 15 16 11. 10 15 12 12 11. 12 15 13 7-15 12 16 11. 14 12 9. 14 9. 50 80 70 0 0 0 0 0 0 0 0 10 10 3 0 0 0 0 10 0 0 0 0 0 0 0 323333333 4 3 4 3 3 3 333333 3233 4 3 33333 P-00000000000000000000000000000000 C6263631333335 625-325 3323663233626 20 21 22 20 20 25 19 23 18 18 18 18 20 21 19 19 20 19 20 19 18 20 20 18 20 18 19 20 19 19 18 22 A 68 .9 82 15 68 17 3 .2 66 .9 + 4 .2 31 51 43 .5 36 .5 96 71 .8 96 .5 + .4 83 .5 05 3 23 3333 3 Step 3: Multiple Regression Now open the other tab of data. Oh my! This has escalated quickly. Now the data table has five variables, and then three more columns of the regression predictions. Here is the breakdown: GPA is a student's self-reported Grade Point Average Age is a student's self-reported age in years Height is a student's height in inches Eye Color is a variable which indicates self-reported eye color. The table all the way on the right contains information relating these numbers to eye color Gender is equal to O for male and 1 for female GPA-hat is the predicted GPA based on the regression coefficients in the "Your Model" table e is the set of residuals for this regression e is the residual squared What you are going to do is estimate a multiple regression, where you are predicting GPA with several other variables, in this case age, height, eye color, and gender. Of course, to do this, you will need to use the advanced capabilities of Excel, and that means I need to try and show you how to do it with pictures Unfortunately, I can only do this with the Windows version of Excel. Godspeed to those with a Mac But first, an explanation. Linear Regression by Ordinary Least Squares finds the best possible coefficients for each variable by minimizing the SSE. It is will never get the SSE down to 0, but it will try to get it as close as possible. Excel's Solver is capable of solving this problem by brute force. It will make millions of guesses for the beta coefficients in a split second, and stop only when it's sure it found the minimum of the SSE. Here is how you do that Excel Solver 1. Enable Solver by going to File -> Options->Add-Ins -> Go... Manage Excel Add-ins Go 2. Make sure "Solver Add-in" is checked like so: Add-Ins available: Analysis ToolPak Analysis ToolPak-VBA Euro Currency Tools Solver Add-in Cancel Browse... Automation... Go back to the "Multiple Regression" spreadsheet and click over to the "Data" tab on the top ribbon. All the way on the right you will see the "Analysis" section, where you should now have the option of starting up "Solver" 3. Data Analysis 2, Solver Analysis 4. Click Solver and fill in the appropriate information 4. Click Solver and fill in the appropriate information Solver Parameters Set Objective To: O Max By Changing Variable Cells: SMS9 OMinOValue Of SMS3:SMS7 Subject to the Constraints: Add Change Delete Reset All Load/Save Make unconstrained Variables Non-Negative Select a Soving Method: GRG Nonlinear Options Solving Method Select the GRG Nonlinear engine for Solver Problems that are smooth nonlinear. Select the LFP Simplex engine for linear Solver Problems, and select the Evolutionary engine for Solver problems that are non-smooth. Solve Close The object you are setting is to have cell M9, which is the SSE, minimized (which is selected in the "To:" section below that field It will minimize this value by changing the values in M3:M7, which are our beta coefficients that make up the linear regression. Make sure the solving method is set to "GRG Nonlinear" and click "Solve". A "Solver Results" window will pop up. Just click "Ok". Take a look at the results now found in cells M3 to M7. These are your beta coefficients 5. 6. 7. 8. 9


