Can you pls help me with question 1

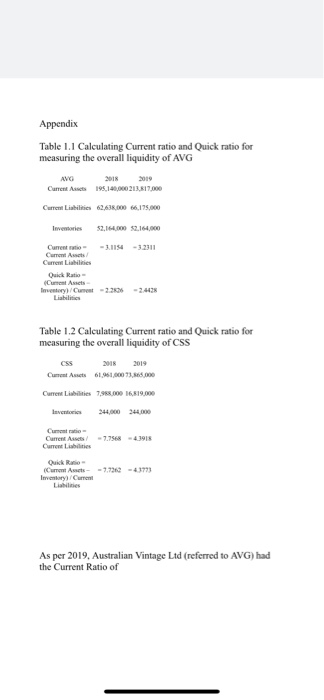
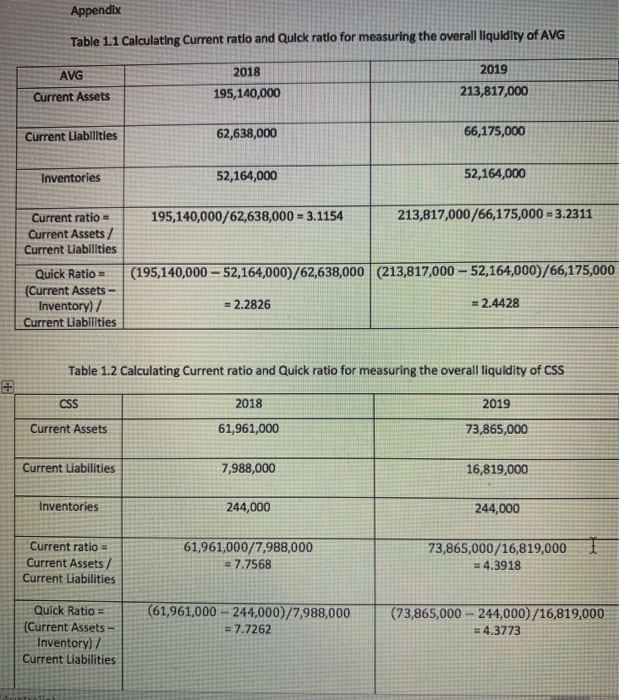
Your team has been hired as financial analysts by Provenance Investment Fund. The Fund has identified the Food, Beverage & Tobacco industry group to be experiencing growth and have selected two firms as potential investments. The Fund requires your team to analyse the financial position and performance of the above assigned two companies for the two stated financial years (2018 and 2019), and to provide a recommendation as to which may be the best company for the Fund to invest into, if any. As a financial analyst, you are primarily concerned with three main financial aspects for each of the two firms: overall liquidity, capital structure and shareholders' profitability. Your task involves answering the following 5 questions in your own words (ie. do not simply cut and paste information from the Annual Report or any other source). You must apply critical thinking concepts when explaining and justifying your choices. BASED ON THE INFORMATION AVAILABLE ON THE DatAnalysis Premium DATABASE FOR BOTH ASSIGNED COMPANIES, ANSWER ALL OF THE FOLLOWING QUESTIONS (1 TO 5 INCLUSIVE). QUESTION 1: Analyse the overall liquidity position for each of the two companies in 2019 as compared to 2018. Calculate the values for two liquidity ratios to help support your answer and justify why you have chosen these ratios. Note: ensure that you analyse in this question, not just describe the ratio values. (2 marks) Appendix Table 1.1 Calculating Current ratio and Quick ratio for measuring the overall liquidity of AVG AVG Current Act 195.140,000213.817,000 Current Liabilities 62/638.000 66,175,000 52,164.000 52.164.000 Currento 2.1154 -3.2311 Current Liabilities Quick Ratio Inventory/cument -2.25 -2.4438 Table 1.2 Calculating Current ratio and Quick ratio for measuring the overall liquidity of CSS 2018 2019 Current Act 1,6100073.68.000 Current 79.00 16,19,000 Current Current A -7.758 -43918 Current Liabilities Quick Current Awets - - 7.732 - 43773 Inventory/ As per 2019. Australian Vintage Ltd (referred to AVG) had the Current Ratio of Appendix Table 1.1 Calculating Current ratio and Quick ratio for measuring the overall liquidity of AVG 2018 AVG Current Assets 2019 213,817,000 195,140,000 Current Liabilities 62,638,000 66,175,000 Inventories 52,164,000 52,164,000 195,140,000/62,638,000 = 3.1154 213,817,000/66,175,000 - 3.2311 Current ratio- Current Assets/ Current Liabilities Quick Ratio (Current Assets Inventory) 7 Current Liabilities (195,140,000 - 52,164,000)/62,638,000 (213,817,000 - 52,164,000)/66,175,000 = 2.2826 = 2.4428 Table 1.2 Calculating Current ratio and Quick ratio for measuring the overall liquidity of CSS + CSS 2018 2019 Current Assets 61,961,000 73,865,000 Current Liabilities 7,988,000 16,819,000 Inventories 244,000 244,000 Current ratio Current Assets/ Current Liabilities 61,961,000/7,988,000 = 7.7568 73,865,000/16,819,000 I = 4.3918 Quick Ratio (Current Assets Inventory) / Current Liabilities (61,961,000 - 244,000)/7,988,000 = 7.7262 (73,865,000 -- 244,000)/16,819,000 = 4.3773


