Answered step by step
Verified Expert Solution
Question
1 Approved Answer
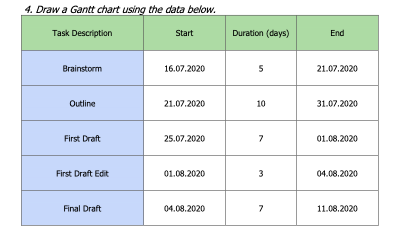
Can you show how to do these questions in excel? 4. Draw a Gantt chart using the data below. begin{tabular}{|c|c|c|c|} hline Task Description & Start
 Can you show how to do these questions in excel?
Step by Step Solution
There are 3 Steps involved in it
Step: 1

Get Instant Access to Expert-Tailored Solutions
See step-by-step solutions with expert insights and AI powered tools for academic success
Step: 2

Step: 3

Ace Your Homework with AI
Get the answers you need in no time with our AI-driven, step-by-step assistance
Get Started


