Capital Budgeting Problem Parameters:
Consider the following expansion capital budgeting problem.
A capital budgeting decision is being considered that would involve an expansion and simultaneous replacement of old equipment. The project is expected to have a 6 year life for the firm.
This project will replace some existing equipment which currently has a book value (BV) of $200k and an estimated market salvage value of $375k. The new project will require new equipment costing $2000k, which will be depreciated straight-line to a book value of $200k at the end of 6 years. Due to new energy efficient technology, replacing the old equipment with the new more efficient equipment will generate an immediate tax credit of 5% of the equipments cost. The expansion will require an additional investment in NWC of $200k.
Sales are expected to increase by $1000k the first year and grow by 15% in years 2 and 3, then by 5% annually during the remaining 6 year life. Cost of goods sold is forecasted to be 45% of the increased sales, and other selling and general administrative expenses are forecasted to be 10% of the increased sales.
It is forecasted that the new equipment will have a salvage value of $300k at the end of the projects 6 year life.
The firms weighted average cost of capital (WACC) for projects of this risk level is 8%. The firms marginal tax rate is T = 40%.
Use the Excel template to complete the capital budgeting analysis.
Your Excel analysis should clearly indicate the cash flow model analysis timeline and should provide the projects:
- NPV,
- IRR,
- PBP,
- PI,
- Scenario Analysis => completion of the scenario analysis grids which provide NPV of the entire cash flow model under the different scenarios indicated in the grids, and
- the projects NPV Profile graph (with proper labels).
Assistance needed only for the two NPV Grids on the right side. Assume all info is correct. Please also explain how the calcualtions were done. Thanks
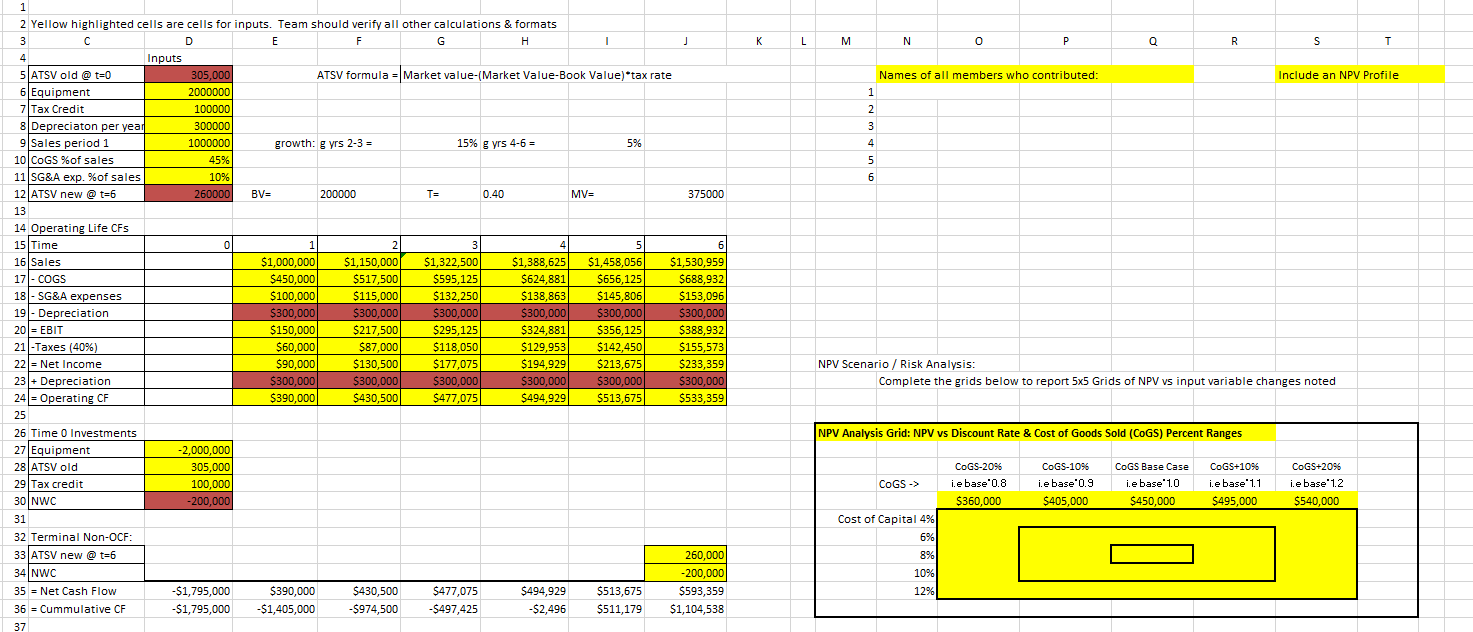
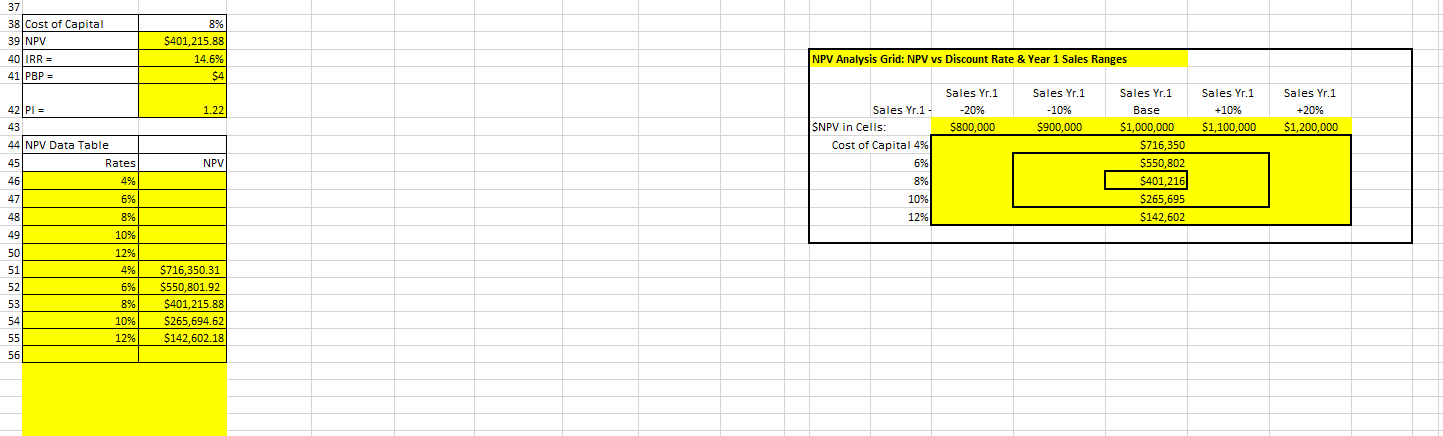
- j L M N P Q R S T Names of all members who contributed: Include an NPV Profile 1 2 3 4 5 6 1 2 Yellow highlighted cells are cells for inputs. Team should verify all other calculations & formats 3 D E F G H 4 Inputs 5 ATSV old @ t=0 305,000 ATSV formula = Market value-(Market Value-Book Value) tax rate 6 Equipment 2000000 z Tax Credit 100000 8 Depreciaton per year 300000 9 Sales period 1 1000000 growth: 8 yrs 2-3 = 15% g yrs 4-6 = 5% 10 COGS %of sales 45% 11 SG&A exp. %of sales 10% 12 ATSV new @t=6 260000 BV= 200000 TE 0.40 MV= 375000 13 14 Operating Life CFs 15 Time 0 1 2 3 4 5 6 16 Sales $1,000,000 $1,150,000 $1,322,500 $1,388,625 $1,458,056 $1,530,959 17 - COGS $450,000 $517,500 $595,125 $624,881 $656,125 $688,932) 18 - SG&A expenses $100,000 $115,000 $132,250 $138,863 $145,806 $153,096 19 - Depreciation $300,000 $300,000 $300,000 $300,000 $300,000 $300,000 20 = EBIT $150,000 $217,500 $295,125 $324,881 $356,125 $388,932 21 -Taxes (40%) $60,000 $87,000 $118,050 $129,953 $142,450 $155,573 22 - Net Income $90,000 $130,500 $177,075 $194,929 $213,675 $233,359 23 + Depreciation $300,000 $300,000 $300,000 $300,000 $300,000 $300,000 24 = Operating CF $390,000 $430,500 $477,075 $494,929 $513,675 $533,359 25 26 Time 0 Investments 27 Equipment -2,000,000 28 ATSV old 305,000 29 Tax credit 100.000 -200,000 31 32 Terminal Non-OCF: 33 ATSV new @t=6 260,000 34 NWC -200,000 35 = Net Cash Flow -$1,795,000 $390,000 $430,500 $477,075 $494,929 $513,675 $593,359 36 = Cummulative CF -$1,795,000 -$1,405,000 -$974,500 -$497,425 -$2,496 $511,179 $1,104,538 37 NPV Scenario / Risk Analysis: Complete the grids below to report 5x5 Grids of NPV vs input variable changes noted NPV Analysis Grid: NPV vs Discount Rate & Cost of Goods Sold (COGS) Percent Ranges COGS -> COGS-2096 i.e base 0.8 $360,000 CoGS-1095 i.e base'0.9 $405,000 COGS Base Case i.e base' 1.0 $450,000 COGS+1096 i.e base' 1.1 $495,000 COGS+2096 i.e base' 1.2 $540,000 30 NWC Cost of Capital 4% 6% 8%) 10% 12% 37 38|Cost of Capital 39 NPV 40 IRR = 41 PBP = 8% $401,215.88 14.6% $4 NPV Analysis Grid: NPV vs Discount Rate & Year 1 Sales Ranges 1.22 42 PI = 43 Sales Yr.1 -20% $800,000 Sales Yr. 1 -10% $900,000 Sales Yr.1 +10% $1,100,000 Sales Yr.1 +20% $1,200,000 Sales Yr.1 - SNPV in Cells: Cost of Capital 4% 6% 8% 44 NPV Data Table 45 Rates 46 4% 47 6% Sales Yr.1 Base $1,000,000 $716,350 $550.802 $401,216 $265,695 $142,602 NPV 10% 48 12% 8% 10% 49 50 51 52 53 54 55 56 12% 4% 6% 8% 10% 12% $716,350.31 $550,801.92 $401,215.88 $265,694.62 $142,602.18 - j L M N P Q R S T Names of all members who contributed: Include an NPV Profile 1 2 3 4 5 6 1 2 Yellow highlighted cells are cells for inputs. Team should verify all other calculations & formats 3 D E F G H 4 Inputs 5 ATSV old @ t=0 305,000 ATSV formula = Market value-(Market Value-Book Value) tax rate 6 Equipment 2000000 z Tax Credit 100000 8 Depreciaton per year 300000 9 Sales period 1 1000000 growth: 8 yrs 2-3 = 15% g yrs 4-6 = 5% 10 COGS %of sales 45% 11 SG&A exp. %of sales 10% 12 ATSV new @t=6 260000 BV= 200000 TE 0.40 MV= 375000 13 14 Operating Life CFs 15 Time 0 1 2 3 4 5 6 16 Sales $1,000,000 $1,150,000 $1,322,500 $1,388,625 $1,458,056 $1,530,959 17 - COGS $450,000 $517,500 $595,125 $624,881 $656,125 $688,932) 18 - SG&A expenses $100,000 $115,000 $132,250 $138,863 $145,806 $153,096 19 - Depreciation $300,000 $300,000 $300,000 $300,000 $300,000 $300,000 20 = EBIT $150,000 $217,500 $295,125 $324,881 $356,125 $388,932 21 -Taxes (40%) $60,000 $87,000 $118,050 $129,953 $142,450 $155,573 22 - Net Income $90,000 $130,500 $177,075 $194,929 $213,675 $233,359 23 + Depreciation $300,000 $300,000 $300,000 $300,000 $300,000 $300,000 24 = Operating CF $390,000 $430,500 $477,075 $494,929 $513,675 $533,359 25 26 Time 0 Investments 27 Equipment -2,000,000 28 ATSV old 305,000 29 Tax credit 100.000 -200,000 31 32 Terminal Non-OCF: 33 ATSV new @t=6 260,000 34 NWC -200,000 35 = Net Cash Flow -$1,795,000 $390,000 $430,500 $477,075 $494,929 $513,675 $593,359 36 = Cummulative CF -$1,795,000 -$1,405,000 -$974,500 -$497,425 -$2,496 $511,179 $1,104,538 37 NPV Scenario / Risk Analysis: Complete the grids below to report 5x5 Grids of NPV vs input variable changes noted NPV Analysis Grid: NPV vs Discount Rate & Cost of Goods Sold (COGS) Percent Ranges COGS -> COGS-2096 i.e base 0.8 $360,000 CoGS-1095 i.e base'0.9 $405,000 COGS Base Case i.e base' 1.0 $450,000 COGS+1096 i.e base' 1.1 $495,000 COGS+2096 i.e base' 1.2 $540,000 30 NWC Cost of Capital 4% 6% 8%) 10% 12% 37 38|Cost of Capital 39 NPV 40 IRR = 41 PBP = 8% $401,215.88 14.6% $4 NPV Analysis Grid: NPV vs Discount Rate & Year 1 Sales Ranges 1.22 42 PI = 43 Sales Yr.1 -20% $800,000 Sales Yr. 1 -10% $900,000 Sales Yr.1 +10% $1,100,000 Sales Yr.1 +20% $1,200,000 Sales Yr.1 - SNPV in Cells: Cost of Capital 4% 6% 8% 44 NPV Data Table 45 Rates 46 4% 47 6% Sales Yr.1 Base $1,000,000 $716,350 $550.802 $401,216 $265,695 $142,602 NPV 10% 48 12% 8% 10% 49 50 51 52 53 54 55 56 12% 4% 6% 8% 10% 12% $716,350.31 $550,801.92 $401,215.88 $265,694.62 $142,602.18