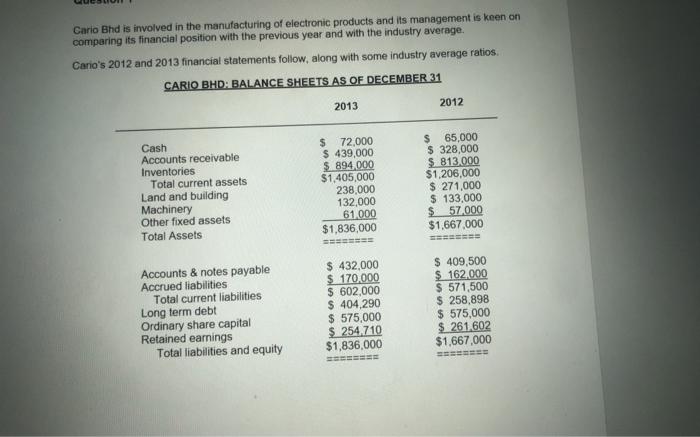
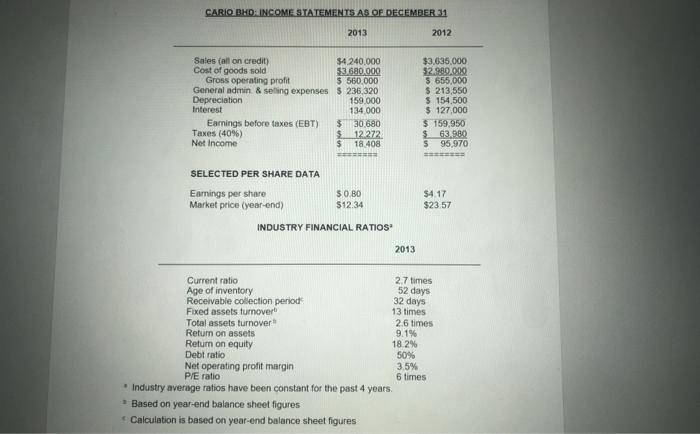
Cario Bhd is involved in the manufacturing of electronic products and its management is keen on comparing its financial position with the previous year and with the industry average. Cario's 2012 and 2013 financial statements follow, along with some industry average ratios. CARIO BHD BALANCE SHEETS AS OF DECEMBER 31 2012 2013 Cash Accounts receivable Inventories Total current assets Land and building Machinery Other fixed assets Total Assets $ 72,000 $ 439,000 $ 894,000 $1,405,000 238.000 132,000 61.000 $1,836,000 $ 65,000 $ 328,000 $ 813000 $1,206,000 $ 271,000 $ 133,000 $57.000 $1,667,000 Accounts & notes payable Accrued liabilities Total current liabilities Long term debt Ordinary share capital Retained earnings Total liabilities and equity $ 432,000 $ 170,000 $ 602.000 $ 404,290 $ 575,000 $ 254.710 $1,836,000 $ 409,500 $ 162.000 $ 571,500 $ 258,898 $ 575,000 $ 261,602 $1,667,000 CARIO BHD: INCOME STATEMENTS AS OF DECEMBER 31 2013 2012 Sales (all on credit) $4 240.000 Cost of goods sold 53.680.000 Gross operating profit $ 560,000 General admin & selling expenses 5 236,320 Depreciation 159.000 Interest 134 000 Earnings before taxes (EBT) $ 30,680 Taxes (40%) $ 12.272 Net Income $ 18.408 $3,635,000 $2.989.000 3 655,000 $ 213,550 $ 154,500 $ 127,000 $ 159,950 $63.380 S 95 970 SELECTED PER SHARE DATA Earnings per share Market price (year-end) 50.80 $12.34 $4.17 $23.57 INDUSTRY FINANCIAL RATIOS 2013 Current ratio 2.7 times Age of inventory 52 days Receivable collection period 32 days Fixed assets turnover 13 times Total assets turnover 26 times Return on assets 9.1% Return on equity 18.2% Debt ratio 50% Net operating profit margin 3.5% P/E ratio 6 times Industry average ratios have been constant for the past 4 years - Based on year-end balance sheet figures Calculation is based on year-end balance sheet figures