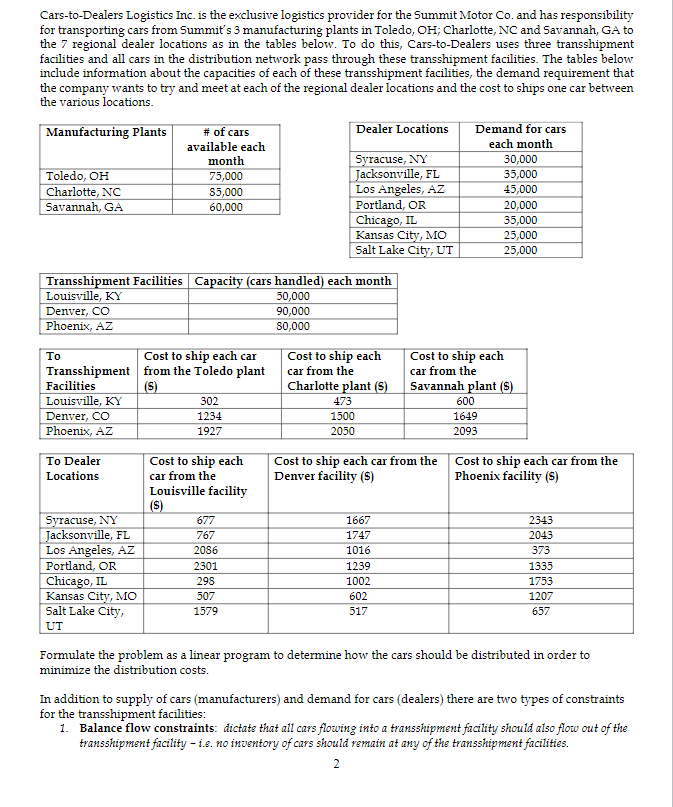
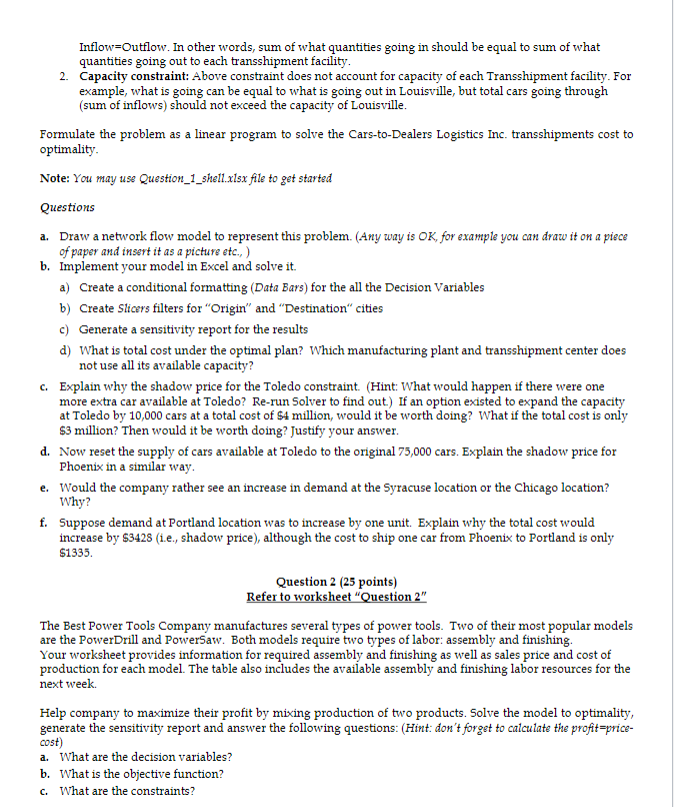
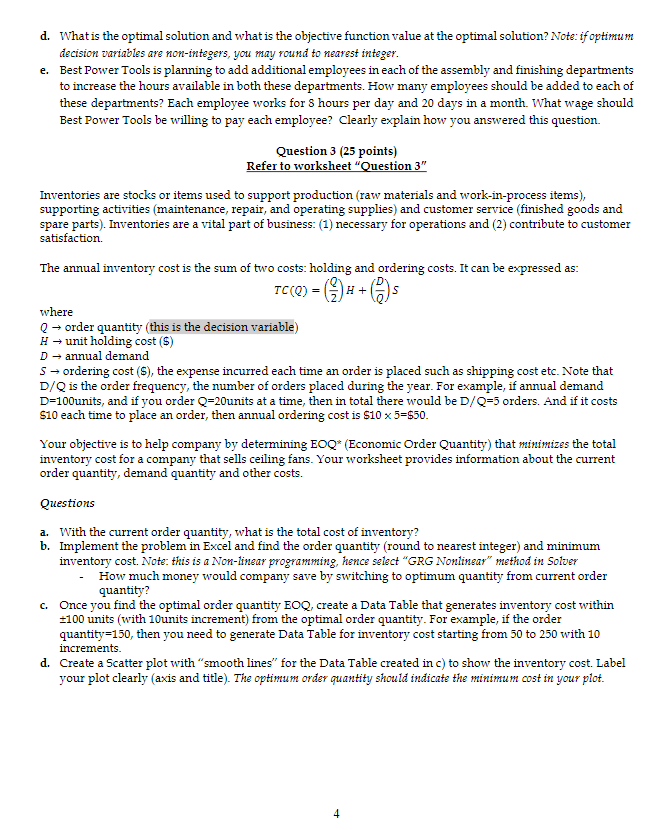
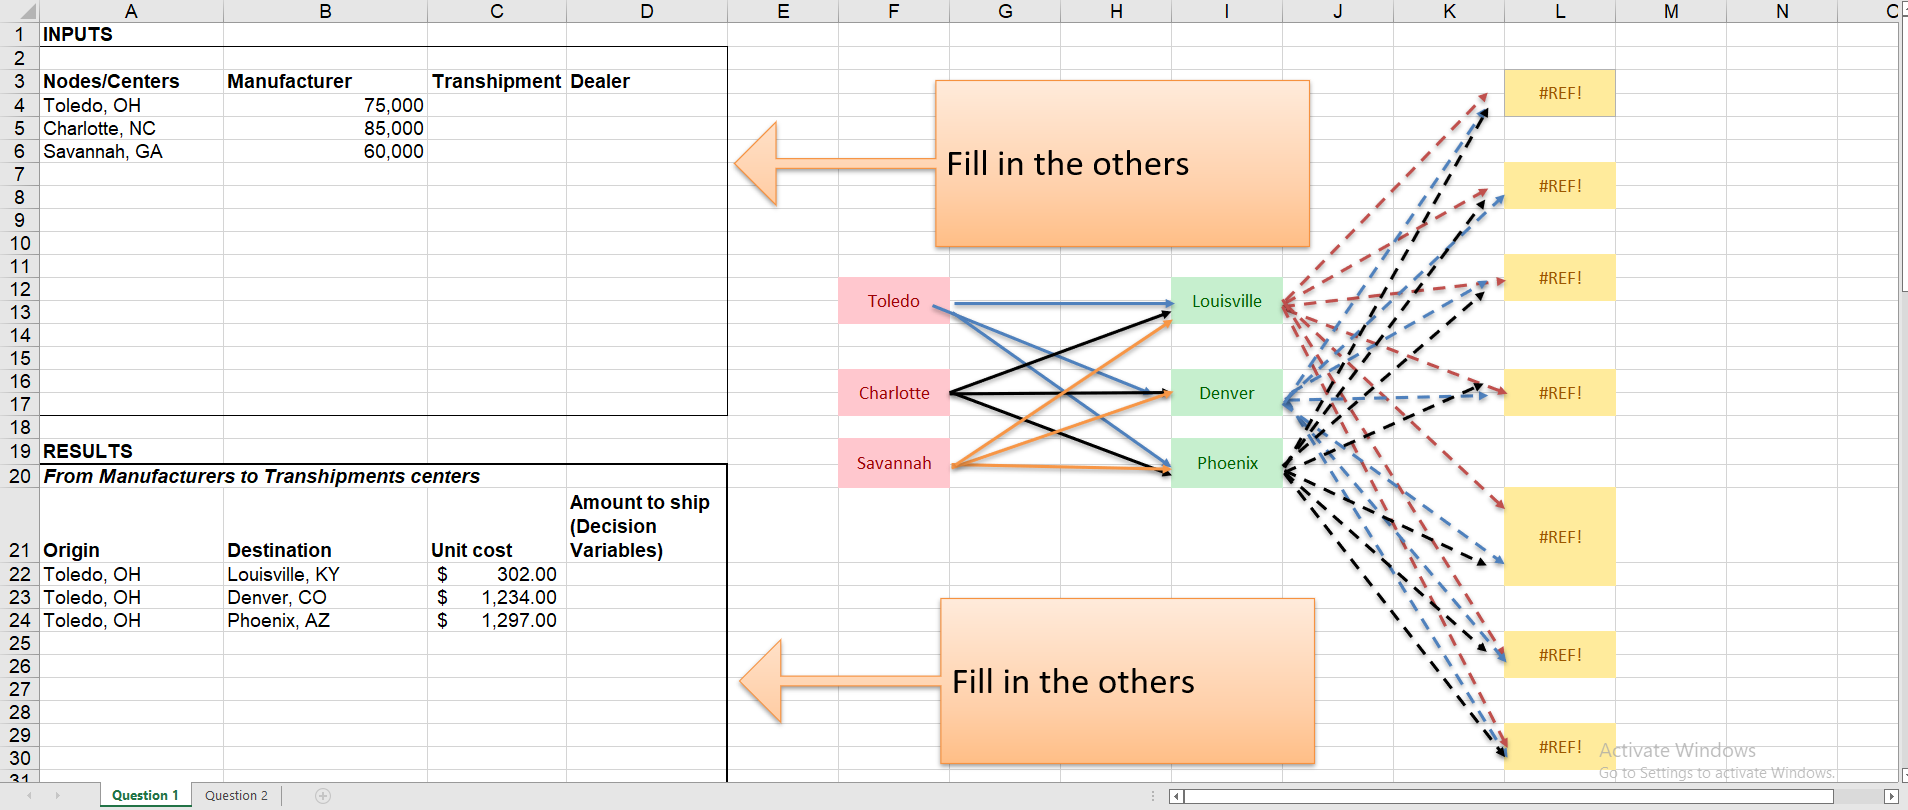
Cars-to-Dealers Logistics Inc. is the exclusive logistics provider for the Summit Motor Co. and has responsibility for transporting cars from Summit's 3 manufacturing plants in Toledo, OH; Charlotte, NC and Savannah, GA to the 7 regional dealer locations as in the tables below. To do this, Cars-to-Dealers uses three transshipment facilities and all cars in the distribution network pass through these transshipment facilities. The tables below include information about the capacities of each of these transshipment facilities, the demand requirement that the company wants to try and meet at each of the regional dealer locations and the cost to ships one car between the various locations. Manufacturing Plants Dealer Locations # of cars available each month Demand for cars each month 30,000 Syracuse, NY 75,000 Jacksonville, FL 35,000 Toledo, OH Charlotte, NC Savannah, GA $5,000 Los Angeles, AZ 45,000 60,000 Portland, OR 20,000 Chicago, IL 35,000 25,000 Kansas City, MO Salt Lake City, UT 25,000 Transshipment Facilities Capacity (cars handled) each month Louisville, KY 50,000 90,000 Denver, CO Phoenix, AZ 80,000 To Cost to ship each car from the Toledo plant Transshipment Facilities Louisville, KY Cost to ship each car from the Charlotte plant (S) Cost to ship each car from the Savannah plant (S) (S) 302 473 600 Denver, CO 1234 1500 1649 Phoenix, AZ 1927 2050 2093 To Dealer Locations Cost to ship each car from the Louisville facility Cost to ship each car from the Denver facility (S) Cost to ship each car from the Phoenix facility (S) (S) 677 1667 2343 Syracuse, NY Jacksonville, FL 767 1747 2043 2086 1016 373 Los Angeles, AZ Portland, OR Chicago, IL 2301 1239 1335 298 1002 1753 1207 Kansas City, MO 507 602 Salt Lake City, 1579 517 657 UT Formulate the problem as a linear program to determine how the cars should be distributed in order to minimize the distribution costs. In addition to supply of cars (manufacturers) and demand for cars (dealers) there are two types of constraints for the transshipment facilities: 1. Balance flow constraints: dictate that all cars flowing into a transshipment facility should also flow out of the transshipment facility - i.e. no inventory of cars should remain at any of the transshipment facilities. 2 Inflow=Outflow. In other words, sum of what quantities going in should be equal to sum of what quantities going out to each transshipment facility. 2. Capacity constraint: Above constraint does not account for capacity of each Transshipment facility. For example, what is going can be equal to what is going out in Louisville, but total cars going through (sum of inflows) should not exceed the capacity of Louisville. Formulate the problem as a linear program to solve the Cars-to-Dealers Logistics Inc. transshipments cost to optimality. Note: You may use Question_1_shell.xlsx file to get started Questions a. Draw a network flow model to represent this problem. (Any way is OK, for example you can draw it on a piece of paper and insert it as a picture etc.,) b. Implement your model in Excel and solve it. a) Create a conditional formatting (Data Bars) for the all the Decision Variables b) Create Slicers filters for "Origin" and "Destination" cities c) Generate a sensitivity report for the results d) What is total cost under the optimal plan? Which manufacturing plant and transshipment center does not use all its available capacity? c. Explain why the shadow price for the Toledo constraint. (Hint: What would happen if there were one more extra car available at Toledo? Re-run Solver to find out.) If an option existed to expand the capacity at Toledo by 10,000 cars at a total cost of $4 million, would it be worth doing? What if the total cost is only $3 million? Then would it be worth doing? Justify your answer. d. Now reset the supply of cars available at Toledo to the original 75,000 cars. Explain the shadow price for Phoenix in a similar way. e. Would the company rather see an increase in demand at the Syracuse location or the Chicago location? Why? f. Suppose demand at Portland location was to increase by one unit. Explain why the total cost would increase by $3428 (1i.e., shadow price), although the cost to ship one car from Phoenix to Portland is only $1335. Question 2 (25 points) Refer to worksheet "Question 2" The Best Power Tools Company manufactures several types of power tools. Two of their most popular models are the PowerDrill and PowerSaw. Both models require two types of labor: assembly and finishing. Your worksheet provides information for required assembly and finishing as well as sales price and cost of production for each model. The table also includes the available assembly and finishing labor resources for the next week. Help company to maximize their profit by mixing production of two products. Solve the model to optimality, generate the sensitivity report and answer the following questions: (Hint: don't forget to calculate the profit-price- cost) a. What are the decision variables? b. What is the objective function? c. What are the constraints? d. What is the optimal solution and what is the objective function value at the optimal solution? Note: if optimum decision variables are non-integers, you may round to nearest integer. e. Best Power Tools is planning to add additional employees in each of the assembly and finishing departments to increase the hours available in both these departments. How many employees should be added to each of these departments? Each employee works for 8 hours per day and 20 days in a month. What wage should Best Power Tools be willing to pay each employee? Clearly explain how you answered this question. Question 3 (25 points) Refer to worksheet "Question 3" Inventories are stocks or items used to support production (raw materials and work-in-process items), supporting activities (maintenance, repair, and operating supplies) and customer service (finished goods and spare parts). Inventories are a vital part of business: (1) necessary for operations and (2) contribute to customer satisfaction. The annual inventory cost is the sum of two costs: holding and ordering costs. It can be expressed as: TC (Q) = (2) H+ (2) S where Q order quantity (this is the decision variable) H unit holding cost ($) D annual demand S ordering cost (S), the expense incurred each time an order is placed such as shipping cost etc. Note that D/Q is the order frequency, the number of orders placed during the year. For example, if annual demand D=100units, and if you order Q=20units at a time, then in total there would be D/Q=5 orders. And if it costs $10 each time to place an order, then annual ordering cost is $10 x 5=$50. Your objective is to help company by determining EOQ* (Economic Order Quantity) that minimizes the total inventory cost for a company that sells ceiling fans. Your worksheet provides information about the current order quantity, demand quantity and other costs. Questions a. With the current order quantity, what is the total cost of inventory? b. Implement the problem in Excel and find the order quantity (round to nearest integer) and minimum inventory cost. Note: this is a Non-linear programming, hence select "GRG Nonlinear" method in Solver How much money would company save by switching to optimum quantity from current order quantity? c. Once you find the optimal order quantity EOQ, create a Data Table that generates inventory cost within +100 units (with 10units increment) from the optimal order quantity. For example, if the order quantity=150, then you need to generate Data Table for inventory cost starting from 50 to 250 with 10 increments. d. Create a Scatter plot with "smooth lines" for the Data Table created in c) to show the inventory cost. Label your plot clearly (axis and title). The optimum order quantity should indicate the minimum cost in your plot. 4 A 1 INPUTS 2 3 Nodes/Centers 4 Toledo, OH 5 Charlotte, NC 6 Savannah, GA 7 8 9 10 11 12 34567890 75,000 85,000 60,000 18 19 RESULTS 20 From Manufacturers to Transhipments centers 21 Origin 22 Toledo, OH 23 Toledo, OH Unit cost $ Destination Louisville, KY Denver, CO Phoenix, AZ $ 24 Toledo, OH $ 25 26 27 28 29 30 31 13 14 15 16 17 B Manufacturer Question 1 Transhipment Dealer Question 2 302.00 1,234.00 1,297.00 D Amount to ship (Decision Variables) E F Toledo Charlotte Savannah G H Fill in the others M Louisville Denver Phoenix Fill in the others J K M #REF! #REF! #REF! #REF! #REF! #REF! #REF! Activate Windows N Go to Settings to activate Windows. CE Cars-to-Dealers Logistics Inc. is the exclusive logistics provider for the Summit Motor Co. and has responsibility for transporting cars from Summit's 3 manufacturing plants in Toledo, OH; Charlotte, NC and Savannah, GA to the 7 regional dealer locations as in the tables below. To do this, Cars-to-Dealers uses three transshipment facilities and all cars in the distribution network pass through these transshipment facilities. The tables below include information about the capacities of each of these transshipment facilities, the demand requirement that the company wants to try and meet at each of the regional dealer locations and the cost to ships one car between the various locations. Manufacturing Plants Dealer Locations # of cars available each month Demand for cars each month 30,000 Syracuse, NY 75,000 Jacksonville, FL 35,000 Toledo, OH Charlotte, NC Savannah, GA $5,000 Los Angeles, AZ 45,000 60,000 Portland, OR 20,000 Chicago, IL 35,000 25,000 Kansas City, MO Salt Lake City, UT 25,000 Transshipment Facilities Capacity (cars handled) each month Louisville, KY 50,000 90,000 Denver, CO Phoenix, AZ 80,000 To Cost to ship each car from the Toledo plant Transshipment Facilities Louisville, KY Cost to ship each car from the Charlotte plant (S) Cost to ship each car from the Savannah plant (S) (S) 302 473 600 Denver, CO 1234 1500 1649 Phoenix, AZ 1927 2050 2093 To Dealer Locations Cost to ship each car from the Louisville facility Cost to ship each car from the Denver facility (S) Cost to ship each car from the Phoenix facility (S) (S) 677 1667 2343 Syracuse, NY Jacksonville, FL 767 1747 2043 2086 1016 373 Los Angeles, AZ Portland, OR Chicago, IL 2301 1239 1335 298 1002 1753 1207 Kansas City, MO 507 602 Salt Lake City, 1579 517 657 UT Formulate the problem as a linear program to determine how the cars should be distributed in order to minimize the distribution costs. In addition to supply of cars (manufacturers) and demand for cars (dealers) there are two types of constraints for the transshipment facilities: 1. Balance flow constraints: dictate that all cars flowing into a transshipment facility should also flow out of the transshipment facility - i.e. no inventory of cars should remain at any of the transshipment facilities. 2 Inflow=Outflow. In other words, sum of what quantities going in should be equal to sum of what quantities going out to each transshipment facility. 2. Capacity constraint: Above constraint does not account for capacity of each Transshipment facility. For example, what is going can be equal to what is going out in Louisville, but total cars going through (sum of inflows) should not exceed the capacity of Louisville. Formulate the problem as a linear program to solve the Cars-to-Dealers Logistics Inc. transshipments cost to optimality. Note: You may use Question_1_shell.xlsx file to get started Questions a. Draw a network flow model to represent this problem. (Any way is OK, for example you can draw it on a piece of paper and insert it as a picture etc.,) b. Implement your model in Excel and solve it. a) Create a conditional formatting (Data Bars) for the all the Decision Variables b) Create Slicers filters for "Origin" and "Destination" cities c) Generate a sensitivity report for the results d) What is total cost under the optimal plan? Which manufacturing plant and transshipment center does not use all its available capacity? c. Explain why the shadow price for the Toledo constraint. (Hint: What would happen if there were one more extra car available at Toledo? Re-run Solver to find out.) If an option existed to expand the capacity at Toledo by 10,000 cars at a total cost of $4 million, would it be worth doing? What if the total cost is only $3 million? Then would it be worth doing? Justify your answer. d. Now reset the supply of cars available at Toledo to the original 75,000 cars. Explain the shadow price for Phoenix in a similar way. e. Would the company rather see an increase in demand at the Syracuse location or the Chicago location? Why? f. Suppose demand at Portland location was to increase by one unit. Explain why the total cost would increase by $3428 (1i.e., shadow price), although the cost to ship one car from Phoenix to Portland is only $1335. Question 2 (25 points) Refer to worksheet "Question 2" The Best Power Tools Company manufactures several types of power tools. Two of their most popular models are the PowerDrill and PowerSaw. Both models require two types of labor: assembly and finishing. Your worksheet provides information for required assembly and finishing as well as sales price and cost of production for each model. The table also includes the available assembly and finishing labor resources for the next week. Help company to maximize their profit by mixing production of two products. Solve the model to optimality, generate the sensitivity report and answer the following questions: (Hint: don't forget to calculate the profit-price- cost) a. What are the decision variables? b. What is the objective function? c. What are the constraints? d. What is the optimal solution and what is the objective function value at the optimal solution? Note: if optimum decision variables are non-integers, you may round to nearest integer. e. Best Power Tools is planning to add additional employees in each of the assembly and finishing departments to increase the hours available in both these departments. How many employees should be added to each of these departments? Each employee works for 8 hours per day and 20 days in a month. What wage should Best Power Tools be willing to pay each employee? Clearly explain how you answered this question. Question 3 (25 points) Refer to worksheet "Question 3" Inventories are stocks or items used to support production (raw materials and work-in-process items), supporting activities (maintenance, repair, and operating supplies) and customer service (finished goods and spare parts). Inventories are a vital part of business: (1) necessary for operations and (2) contribute to customer satisfaction. The annual inventory cost is the sum of two costs: holding and ordering costs. It can be expressed as: TC (Q) = (2) H+ (2) S where Q order quantity (this is the decision variable) H unit holding cost ($) D annual demand S ordering cost (S), the expense incurred each time an order is placed such as shipping cost etc. Note that D/Q is the order frequency, the number of orders placed during the year. For example, if annual demand D=100units, and if you order Q=20units at a time, then in total there would be D/Q=5 orders. And if it costs $10 each time to place an order, then annual ordering cost is $10 x 5=$50. Your objective is to help company by determining EOQ* (Economic Order Quantity) that minimizes the total inventory cost for a company that sells ceiling fans. Your worksheet provides information about the current order quantity, demand quantity and other costs. Questions a. With the current order quantity, what is the total cost of inventory? b. Implement the problem in Excel and find the order quantity (round to nearest integer) and minimum inventory cost. Note: this is a Non-linear programming, hence select "GRG Nonlinear" method in Solver How much money would company save by switching to optimum quantity from current order quantity? c. Once you find the optimal order quantity EOQ, create a Data Table that generates inventory cost within +100 units (with 10units increment) from the optimal order quantity. For example, if the order quantity=150, then you need to generate Data Table for inventory cost starting from 50 to 250 with 10 increments. d. Create a Scatter plot with "smooth lines" for the Data Table created in c) to show the inventory cost. Label your plot clearly (axis and title). The optimum order quantity should indicate the minimum cost in your plot. 4 A 1 INPUTS 2 3 Nodes/Centers 4 Toledo, OH 5 Charlotte, NC 6 Savannah, GA 7 8 9 10 11 12 34567890 75,000 85,000 60,000 18 19 RESULTS 20 From Manufacturers to Transhipments centers 21 Origin 22 Toledo, OH 23 Toledo, OH Unit cost $ Destination Louisville, KY Denver, CO Phoenix, AZ $ 24 Toledo, OH $ 25 26 27 28 29 30 31 13 14 15 16 17 B Manufacturer Question 1 Transhipment Dealer Question 2 302.00 1,234.00 1,297.00 D Amount to ship (Decision Variables) E F Toledo Charlotte Savannah G H Fill in the others M Louisville Denver Phoenix Fill in the others J K M #REF! #REF! #REF! #REF! #REF! #REF! #REF! Activate Windows N Go to Settings to activate Windows. CE


