

Question
Case 2 - Matlab code to call function % Case 2: Given N years of weekly sales data, study weekly average and % variability annually
Case 2 - Matlab
code to call function
% Case 2: Given N years of weekly sales data, study weekly average and
% variability annually to estimate future sales characteristics.
% INPUTS:
% Nyrs, nbr years of sales data
% salesSets, annual sets of weekly sales data
% OUTPUTS:
% annMeans, annual means of weekly sales
% annStdDevs, annual standard deviations
% annMins, min of annual sales
% annMaxs, max of annual sales
% -------------------------------------------------------------------------
% SETUP SECTION -----------------------------------------------------------
% generate N years of sales data
Nyrs= 4;
nweeks= 52;
mu= 1000; % sales average
sigma= 100; % sales standard deviation
load('Case2Data'); % loads the variable "salesSets"
% SIMULATION SECTION ------------------------------------------------------
[annMeans,annStdDevs,annMins,annMaxs]= Sales_2_fcn(Nyrs,salesSets);
% REPORT SECTION -------------------------------------------------------
fprintf(' Results 2: ');
fprintf(' Nyrs= %5.0f ',Nyrs);
fprintf(' nweeks=%5.0f ',nweeks);
fprintf(' mu= %5.0f ',mu);
fprintf(' sigma= %5.0f ',sigma);
fprintf(' Yr Mean StdDev Min Max ');
fmta= '%4.0f %8.1f %7.1f %7.0f %7.0f ';
for n=1:1:Nyrs
mean= annMeans(n,1);
stddev= annStdDevs(n,1);
min= annMins(n,1);
max= annMaxs(n,1);
fprintf(fmta,n,mean,stddev,min,max);
end
% set up histogram structure
binwidth= 100;
%binEdges= 500:binwidth:1500; % [500,600,700,...,1400,1500] row vector
%nbins= 10;
binEdges= 700:binwidth:1300; % [500,600,700,...,1400,1500] row vector
nbins= 6;
fprintf(' Histogram data ');
fprintf(' Yr bin=1 2 3 4 5 6 Total ');
fmtb= ' %4.0f %5.0f %5.0f %5.0f %5.0f %5.0f %5.0f %6.0f ';
for n=1:1:Nyrs
X= salesSets(n,1:52);
[binCounts,binEdges]= histcounts(X,binEdges);
yrsum= sum(binCounts);
fprintf(fmtb,n,binCounts,yrsum);
end
% figure to aid interpretation
figure(1)
subplot(4,1,1)
histogram(salesSets(1,1:52),binEdges); % Matlab does this well
title('Case 2: Histogram of weekly sales for 4 years')
%xticklabels(binlabels);
ylabel('Yr 1');
subplot(4,1,2)
histogram(salesSets(2,1:52),binEdges);
ylabel('Yr 2');
subplot(4,1,3)
histogram(salesSets(3,1:52),binEdges);
ylabel('Yr 3');
subplot(4,1,4)
histogram(salesSets(4,1:52),binEdges);
ylabel('Yr 4');
fprintf(' ');
% -------------------------------------------------------------------------
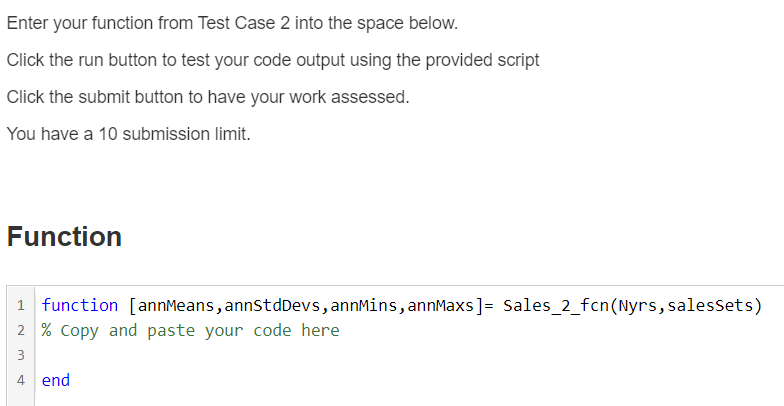
Enter your function from Test Case 2 into the space below. Click the run button to test your code output using the provided script Click the submit button to have your work assessed. You have a 10 submission limit. Function 1 function [annMeans, annstdDevs, annmins, annMaxs ]= Sales_2_fcn(Nyrs, salessets) 2 % Copy and paste your code here 4 end Enter your function from Test Case 2 into the space below. Click the run button to test your code output using the provided script Click the submit button to have your work assessed. You have a 10 submission limit. Function 1 function [annMeans, annstdDevs, annmins, annMaxs ]= Sales_2_fcn(Nyrs, salessets) 2 % Copy and paste your code here 4 end
Step by Step Solution
There are 3 Steps involved in it
Step: 1

Get Instant Access to Expert-Tailored Solutions
See step-by-step solutions with expert insights and AI powered tools for academic success
Step: 2

Step: 3
Ace Your Homework with AI
Get the answers you need in no time with our AI-driven, step-by-step assistance
Get Started
Oracle Database 12c Dba Handbook Manage A Scalable Secure Oracle Enterprise Database Environment
Authors: Bob Bryla
1st Edition
0071798781, 978-0071798785