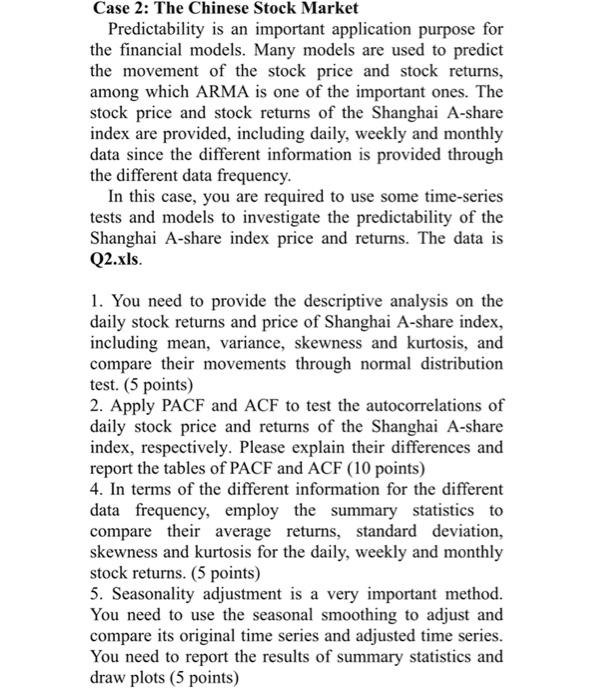
Case 2: The Chinese Stock Market Predictability is an important application purpose for the financial models. Many models are used to predict the movement of the stock price and stock returns, among which ARMA is one of the important ones. The stock price and stock returns of the Shanghai A-share index are provided, including daily, weekly and monthly data since the different information is provided through the different data frequency. In this case, you are required to use some time-series tests and models to investigate the predictability of the Shanghai A-share index price and returns. The data is Q2.xls. 1. You need to provide the descriptive analysis on the daily stock returns and price of Shanghai A-share index, including mean, variance, skewness and kurtosis, and compare their movements through normal distribution test. (5 points) 2. Apply PACF and ACF to test the autocorrelations of daily stock price and returns of the Shanghai A-share index, respectively. Please explain their differences and report the tables of PACF and ACF (10 points) 4. In terms of the different information for the different data frequency, employ the summary statistics to compare their average returns, standard deviation, skewness and kurtosis for the daily, weekly and monthly stock returns. (5 points) 5. Seasonality adjustment is a very important method. You need to use the seasonal smoothing to adjust and compare its original time series and adjusted time series. You need to report the results of summary statistics and draw plots (5 points) Case 2: The Chinese Stock Market Predictability is an important application purpose for the financial models. Many models are used to predict the movement of the stock price and stock returns, among which ARMA is one of the important ones. The stock price and stock returns of the Shanghai A-share index are provided, including daily, weekly and monthly data since the different information is provided through the different data frequency. In this case, you are required to use some time-series tests and models to investigate the predictability of the Shanghai A-share index price and returns. The data is Q2.xls. 1. You need to provide the descriptive analysis on the daily stock returns and price of Shanghai A-share index, including mean, variance, skewness and kurtosis, and compare their movements through normal distribution test. (5 points) 2. Apply PACF and ACF to test the autocorrelations of daily stock price and returns of the Shanghai A-share index, respectively. Please explain their differences and report the tables of PACF and ACF (10 points) 4. In terms of the different information for the different data frequency, employ the summary statistics to compare their average returns, standard deviation, skewness and kurtosis for the daily, weekly and monthly stock returns. (5 points) 5. Seasonality adjustment is a very important method. You need to use the seasonal smoothing to adjust and compare its original time series and adjusted time series. You need to report the results of summary statistics and draw plots (5 points)


