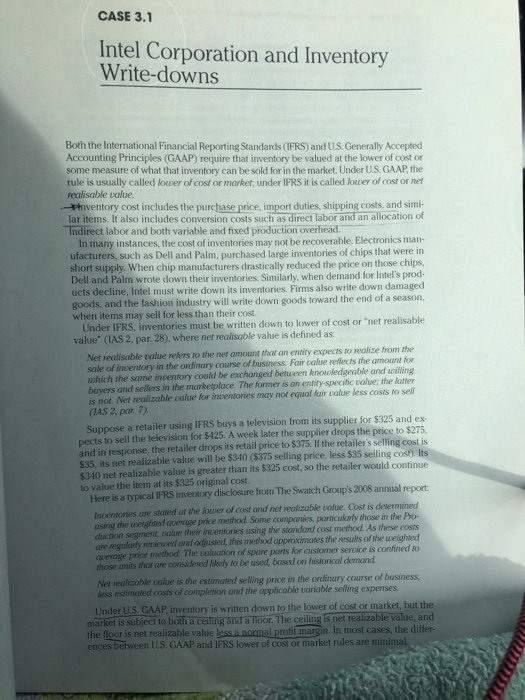
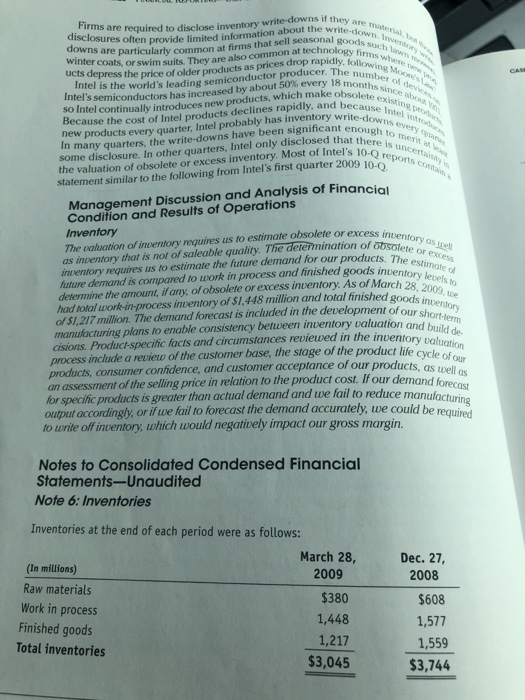
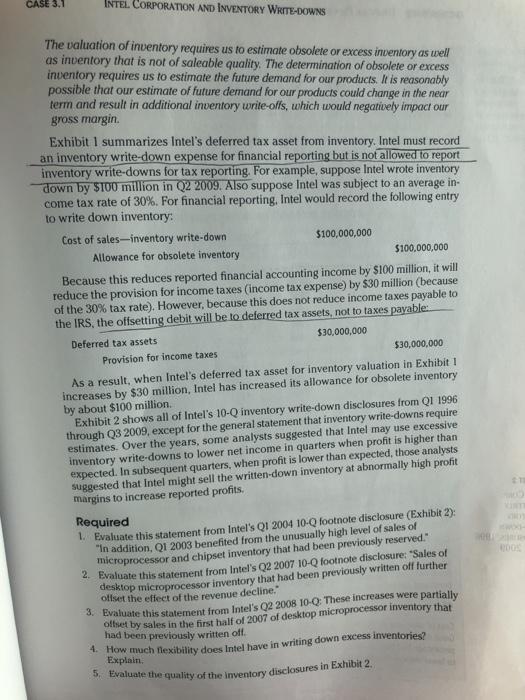
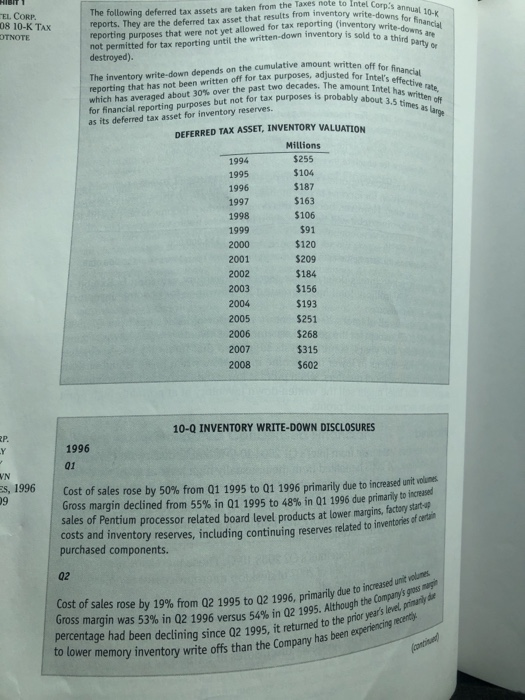
CASE 3.1 Intel Corporation and Inventory Write-downs Both the International Financial Reporting Standards FRS) and U.S. Generally Accepted Accounting Principles (GAAP) require that inventory be valued at the lower of cost or some measure of what that inventory can be sold for in the market. Under US. GAAP, the rule is usually called lower of cost or market, under IFRS it is called lower of cost or net realisable value -Phiventory cost includes the purchase price, import duties, shipping costs, and simi- Indirect labor and both variable and fixed production overhead In many instances, the cost of inventories may not be recoverable. Electronics man ufacturers, such as Dell and Palm, purchased large inventories of chips that were in short supply. When chip manufacturers drastically reduced the price on those chips Dell and Palm wrote down their inventories. Similarly, when demand for Intel's prod- ucts decline, Intel must write down its inventories. Firms also write down damaged goods, and the fashion industry will write down goods toward the end of a season, when items may sell for less than their cost. Under IFRS, inventories must be written down to lower of cost or "net realisable value" (IAS 2, par. 28), where net realisable value is defined as: Net realisable value refers to the net amount thot an entity expects to realize from the sale of inventory in the ordinary course of business. Fair value reflects the amount for which the same inventory could be exchanged between knowledgeable and willing buyers and sellers in the marketplace. The former is an entity-specitic ealue; the katter is not. Net realizable value for inventories may not equal lair value less costs to sell (IAS 2, par. 7) Suppose a retailer using IFRS buys a television from its supplier for $325 and ex pects to sell the television for $425. A week later the supplier drops the price to $275 and in response, the retailer drops its retail price to $375. If the retailer's selling cost is $35, its net realizable value will be $340 ($375 selling price, less $35 selling cost). Its $340 net realizable value is greater than its $325 cost, so the retailer would continue Here is a typical IFRS inventory disclosure from The Swatch Group's 2008 annual report Inventories are stated at the lower of cost and net realizable value. Cost is determined using the weighted average price method Some companies, particukarly those in the Pro- duction segment, value their inventories using the standard cost method As these costs are regularly reviewed ond adjusted, this method approximates the results of the weighted average price method. The valuation of spare pants for customer service is confined to to value the item at its $325 original cost. those unaits that ane considered likely to be used, based on historical demand Net realizable value is the estimated selling price in the ordinary course of business less estimated costs of completion and the applicable variable seling expenses Under U.S GAAP, inventory is written down to the lower of cost or market, but the market is subject to both a celing and a loor. The ceiling is net realizable value, and the floor is net realizable value lessa.normal profi margin. In most cases, the differ- ences between U.S. GAAP and IFRS lower of cost or market rules are minimal they Firms are required to disclose inventory write aat a n downsare soen provide limited information about the w wintr articularly common at firms that sell seasonal oo or swim suits. They are also common at technologych els semiconductors has increased by about 50% every 18 monmb so Intel continually introduces new products, which make obso Because the cost of Intel products declines rapidly, and beca new products every quarter, Intel probably has inventory write n many quarters, the write-downs have been significant enou some disclosure. In other quarters, Intel only disclosed that thugh to mey the valuation of obsolete or excess inventory, Most of Intel's 10-ie statement similar to the following from Intel's first quarter 20090 the price of older products as prices drop rapidly he world's leading semiconductor producer. The cause l orts con Condition and Results of Operations Inventory Management Discussion and Analysis of Financi The valuation of inventory requires us to estimate obsolete or excess ine as inventory that is not of saleable quality. The derenmination of obsolet inventory requires us to estimate the future demand for our products. The or excess estimate o levels to determine the amount, if any, of obsolete or excess inventory. As of March 28 l had total work-in-process inventory of $1,448 million and total finished of $1,217 million. The demand forecast is included in the development of oursory manufacturing plans to enable consistency between inventory valuation cisions. Product-specific facts and circumstances reviewed in the invento process include a review of the customer base, the stage of the product life an assessment of the selling price in relation to the product cost. If our dem cycle of fidence, and customer acceptance of our products, as wel our products, consumer con for specific products is greater than actual demand and we fail to reduce manufacturine output accordingly, or if we fail to forecast the demand accurately, we could be requiresd to write off inventory, which would negatively impact our gross margin. Notes to Consolidated Condensed Financial Statements-Unaudited Note 6: Inventories Inventories at the end of each period were as follows: March 28, 2009 $380 1,448 1,217 $3,045 Dec. 27, (In millions) Raw materials Work in process Finished goods Total inventories 2008 $608 1,577 1,559 $3,744 CASE 3. INTEL CORPORATION AND INVENTORY WTHows The valuation of inventory requires us to estimate obsolete or excess inventory as uel as inventory that is not of saleable quality. The determination of obsolete or excess inventory requires us to estimate the future demand for our products. It is reasonably possible that our estimate of future demand for our products could change in the near term and result in additional inventory write-offs, which would negatively impact our gross margin. Exhibit 1 summarizes Intel's deferred tax asset from inventory Intel must record n inventory write-down expense for financial reporting but is not allowed to report inventory write-downs for tax reporting. For example, suppose Intel wrote inventory down by S1O0 million in 02 2009. Also suppose Intel was subject to an average in come tax rate of 30%. For financial reporting, Intel would record the following entry to write down inventory: Cost of sales-inventory write-down $100,000,000 Allowance for obsolete inventory $100,000,000 Because this reduces reported financial accounting income by $100 million, it will reduce the provision for income taxes (income tax expense) by $30 million (because of the 30% tax rate). However, because this does not reduce income taxes payable to the IRS, the offsetting debit will be to deferred tax assets, not to taxes payable Deferred tax assets $30,000,000 $30,000,000 Provision for income taxes As a result, when Intel's deferred tax asset for inventory valuation in Exhibit 1 increases by $30 million, Intel has increased its allowance for obsolete inventory by about $100 million. Exhibit 2 shows all of Intel's 10-Q inventory write-down disclosures from Q1 1996 through Q3 2009, except for the general statement that inventory write-downs require estimates. Over the years, some analysts suggested that Intel may use excessive inventory write-downs to lower net income in quarters when profit is higher than expected. In subsequent quarters, when profit is lower than expected, those analysts suggested that Intel might sell the written-down inventory at abnormally high profit margins to increase reported profits. Required 1. Evaluate this statement from Intel's Q1 2004 10-Q footnote disclosure (Exhibit 2): In addition, Q1 2003 benefited from the unusually high level of sales of microprocessor and chipset inventory that had been previously reserved." Evaluate this statement from Intel's Q2 2007 10-Q footnote disclosure: "Sales of offset the effect of the revenue declin e0 microprocessor inventory that had been previously written off further uate this statement from Intel's Q2 2008 10-Q: These increases were partialy aset by sales in the first half of 2007 of desktop microprocessor had been previously written off 4. How Explanuch flexibility does Intel have in writing down excess inventories? Explain. 5. Ev quality of the inventory disclosures in Exhibit 2 Taxes note to Intel Corn' The following deferred tax assets are taken from the reports. They are the deferred tax asset that results from inventory write-down nnual 10- reporting purposes that were not yet allowed for tax reporting (inventory write or financ not permitted for tax reporting until the written-down inventory is sold toahae destroyed) EL CORP 08 10-K TAX OTNOTE inventory write-down depends on the cumulative amount reporting that has not been written off for tax purposes, adjusted which has averaged about 30% over the past two decades. Thean r Intel's et for financial reporting purposes but not for tax purposes is as its deferred tax asset for inventory reserves. written off for financial for Intel's effective two decades. The amount Intel has off as large DEFERRED TAX ASSET, INVENTORY VALUATION 1994 1995 1996 1997 1998 1999 Millions $255 104 $187 $163 $106 $120 $209 $184 $156 $193 $251 $268 $315 $602 2001 2002 2003 2004 10-Q INVENTORY WRITE-DOWN DISCLOSURES 1996 Cost of sales rose by 50% from Q1 1995 to Q1 1996 primarily due to increased unit dins Gross margin declined from 55% in Q1 1995 to 48% in Q1 1996 due primany to incresed sales of Pentium processor related board level products at lower margins, factory stat costs and inventory reserves, including continuing reserves related to invertres S, 1996 purchased components Cost of sales rose by 19% from Q2 1995 to Q2 1996, primarily due to ne ryges Gross margin was 53% in Q2 1996 versus 54% in Q2 1995, Although percentage had been declining since 02 1995, it returned to theening to the prior year's level prinanily de er memory inventory write offs than the Company has been EXHIBIT 2- of sales d eclined by 5% from Q1 1996 to Q1 1997 due to shifts inp INTEL CORP. factory efficiencies due to increased volume. Costs for Q1 of 1996lirchased inventory reserves, including reserves r NVENTORY WRITE-DOWN DISCLOSURES, TO Q3, 2009 components. Gross margin increased dua unusually o included related to from 48% in Q1 1996 to more favorable product mix and the reduced costs inventories of 64% in Q1 1997 due to tne discussed above. 1998 02 Cost of sales increased by 29% from 02 1997 to 02 1998 due to the shift in product is toe the Pentium(R) II processor, reflecting the cost of purchased components for the Singte Contact ("SEC") cartridge, higher unitvolumes, and higherfixed costs. In addition, in 2 I e Edge 1998 reductions in product costs on the highest volume processors caused invn in Q2 1997 primarily due to the lower processor prices, the impact of the SEC cartridge, u written down to the new lower costs. Gross margin decreased to 49% in Q2 1998 from 61% inventory write-downs and higher fixed costs. 1999 02 | Cost of sales decreased by 8% in Q2 1999 compared to O2 1998 primaril unit costs for microprocessors in 02 1999 partially offset by higher unit s addition, cost of sales in 02 1998 included unusually high inventory write-downs. The lower unit costs in Q2 1999 were achieved primarily through redesigned microprocessor products with lower-cost as factory efficiencies and lower purchase prices on the purchased components. The gross margin percentage increased to 59% in Q2 1999, up from 49% in Q2 1998. The improvement in gross margin was primarily a result of lower unit costs in the Intel Architecture Business Group operating segment in 02 1999, as well as the absence of the unusually high inventory write-downs recognized in 02 1998, partially offset by the impact of lower prices in 02 1999 due to lower ales volumes. I packaging, including packaging using fewer purchased components, as we 1 03 Cost of sales decreased by 3% in the first nine months of 1999 compared to the first nine months of 1998. In the Intel Architecture Business Group operating segment, lower unit costs for microprocessors in the first nine months of 1999 and the absence in 1999 of the unusually high inventory write-downs recognized in the first nine months of 1998 were partially offset by higher unit sales volumes in the first nine months of 1999. 2001 Although the total cost of sales increased 8% in Q1 2001 compared to Q1 2000, the cost of sales within the Intel Architecture Group operating segment decreased slightly for the same period. The decrease was primarily due to lower sales volume as well as lower unit costs of microprocessors as a result of lower cost packaging. partially offset by increased start-up costs related to 300-millimeter wafer manufacturing and 0.13-micron process technology Within the "all other" c volume of flash memory and the impact of higher inventory reserves in the flash networking and communications businesses more than offset the decreased costs fro Intel Architecture Group. ategory for segment reporting, higher costs due to higher sales (continued) 02 02 2001 compared to 02 2 the same pero was offset by a higher Total cost of sales was essentially flat in within the Intel Architecture Group operating segment was also flat fos and the sales volume of microprocessors Lower cost of sales due to a lower average cost per unit and higher start-up costs related to the 0.13-micron of sales increased slightly primarily due to the impact gory for in the flash memory and networking and communications busi VN ramp and 300-millimeter wafer manufact reserves by the impact of lower unit volumes 03 Es, 1996 fer manufacturing. Within the "all otherTon proc businesses, partiaily Net operating results decreased by $683 million to a loss of $236 million in months of 2001 from a profit of $447 million in the first nine months of 2 the irst to the impact of underutilized factory capacity, lower flash memory unit sales Primarily volumme and higher inventory reserves 2002 with a loss of $150 million in 01 2002 compared to a loss of $153 million in o eflat, compared to Despite the decline in net revenues for ICG, net operating results were approxi 1 2001. was primarily due to the impact of lower inventory write-downs in 01 2002 higher-than-normal write- downs in Q1 2001, as well as lower operating expenses, offet h the impact of lower revenues across all product lines in 01 2002 02 Our gross margin percentage decreased to 47% for Q2 2002 from 48% in Q2 2001, prima due to the Web hosting business wind down charge. Excluding the impact of this charge, the gross margin percentage increased to 49%, primarily due to better overall factory ca utilization and lower ICG inventory write-downs in Q2 2002, compared to higher than n ICG inventory write-downs in 02 2001. pacity normal 03 Cost of sales for the first nine months of 2002 was approximately flat compared to the first nine months of 2001. In the Intel Architecture business, lower start-up manufacturing costs were more than offset by higher costs related to significantly higher volumes and higher unit costs of microprocessors, including microprocessors for the Microsoft Xbox. Cost of sales was lower due to the impact of lower unit volumes in ICG, as well as lower inventory write-downs for both ICG and WCCG. 2003 01 Operating income increased to $1,913 milion in 01 2003, compared to $1,802 million in 01 2002. The increase was primarily due to the 01 2002 impact of a charge of $155 million related to a setlement agreement with Intergraph Corporation and, in Q1 2003, her iet volumes of microprocessors and an unusually high level of sales of microprocessor a inventory that had previously been reserved. cont INTEL CORP. QUARTERLY INVENTORY WRITE-Down DISCLOSURE To Q3, 200 02 The operating loss increased to $143 million in 02 2003 from a $127 million loss in Q2 2002 imarily due to the mix shift to lower-margin wired Ethernet connections. In the ue current ment, sales of wireless Ethernet connections sold in conjunction with competitive environ arocessors and chipsets comprising the Intel Centrino mobile technology also increased the onerating loss. These negative impacts were partially offset by lower inventory write-down as well as lower operating expenses in 02 2003 as we continued our efforts to streamline rations and refocus on our core strategic areas ope 2004 01 Opera ting income increased $1.1 billion, or 58%, in Q1 2004 compared to Q1 2003. The increase was primarily due to the impact of higher revenue and lower unit costs for microprocessors. These increases were partially offset by a $162 million charge in Q1 2004 relating to a settlement agreement with Intergraph Corporation. In addition, 01 2003 benefited from the unusually high level of sales of microprocessor and chipset inventory that had been previously reserved. 02 The operating loss decreased to $126 million in 02 2004, from a loss of $255 million in 02 2003. Higher revenue, as well as the absence of costs incurred in 02 2003 for underutilized factory capacity for flash memory products, improved the operating results. In addition, due to improved demand, sales of flash memory product inventory that had been previously reserved contributed to the lower operating loss. These improvements were partially offset by higher costs for flash memory products as we sold higher density products, as well as the impact cf higher inventory write-offs primarily for certain applications and cellular processors. 03 Operating income decreased $109 million, or 4%, in Q3 2004 compared to Q3 2003, The decrease was primarily due to higher operating expenses as well as higher inventory write downs, partially offset by higher revenue from sales of microprocessors (see "Operating Expenses" below for further discussion on operating expense fluctuations). 2006 01 | 0perating income decreased $1.0 billion, or 42%, in Q1 2006 compared to Q1 2005, The significant decrease was primarily due to lower microprocessor revenue, the impact of d write-downs of chipset inventory and higher operating expenses. These decreases were partially offset by approximately $190 milion of lower start-up costs in 01 200e 02 0perating income decreased $250 million, or 11% in the first half of 2006 compared to the first half of 2005. The decline was primarily caused by an increase in operating expenses, and to a lesser extent, higher write-down of inventory. A majori ty of the decline was offset by the effects of higher revenue, and to a lesser extent, by approximately $170 start-up costs in the first half of 2006. million of lower continued 16 SECTION THREE FINANCIAL Operating income decreased by S 178 million, or 9%, in the first half of 2007 first half of 2006. 7 HIBIT 2- 2007 02 the revenue rechnology, as well as approximately $180 million of higher factory undeour 45-nm e dechi were offset by lower operating expenses. Sales of desktop microprocessor been previously written off further o ARTERLY ENTORY UTE-DOWN t half of 2006. The decrease in operating income was primarily due to tb comp that ha 180 es of Approximately $400 million of higher stam million of higher factory underutiizaton Proces ine. tely $400 million of higher start-up costs, primarily related torevenue of the SE 1996 03, 2009 previously written off further offiet the effect of the revenue declinevory 2008 lower in the first quarter of 2008 as 01 our Gross margin as a percentage of revenue was to the fourth quarter of 2007 as a result of lower mi write-offs, (and] higher microprocessor unit costs as we transition to productsusev 45-nm process technology, and higher start-up costs associated with that transit related due to Operating income decreased by $197 million, or 14%, in Q1 2008 compared to Q1 20 of to process development and advertising. Higher chipset unit costs and sales in O offs mobility microprocessor inventory that had been previously written off were more by lower microprocessor unit costs and higher microprocessor and chipset revenue 02 Operating income increased by $1.7 billion, or 100%, in the first half of 2008 compared to the first half of 2007. The increase in operating income was primarily due to higher microprocessor revenue and approximately $330 million of lower start-up costs, p related to our 45-nm process technology. Lower unit cost for microprocessors and chinsets and $180 million of lower factory underutilization charges also contributed to the increase in operating income. These increases were partially offset by sales in the first half of 2007 of desktop microprocessor inventory that had been previously written off. 2009 03 Our gross margin percentage for the third quarter compared to the second quarter was positively impacted by higher microprocessor sales volume, lower microprocessor underutilization charges, and lower startup costs as we transition into producticn using our unit costs, lower factory 32-nm process technology. These improvements to our gross margin percentage were partialy offset by inventory write-offs of our new 32-nm microprocessor products that were not yet qualified for sale. As we move into the fourth our gross margi and lower factory underutilization charge quarter we expect our gross margin percentage to e further as 32-nm products built in the fourth quarter are qualified for sale. In additon. n percentage is expected to increase due to higher microprocessor sales volume s on increased production. CASE 3.1 Intel Corporation and Inventory Write-downs Both the International Financial Reporting Standards FRS) and U.S. Generally Accepted Accounting Principles (GAAP) require that inventory be valued at the lower of cost or some measure of what that inventory can be sold for in the market. Under US. GAAP, the rule is usually called lower of cost or market, under IFRS it is called lower of cost or net realisable value -Phiventory cost includes the purchase price, import duties, shipping costs, and simi- Indirect labor and both variable and fixed production overhead In many instances, the cost of inventories may not be recoverable. Electronics man ufacturers, such as Dell and Palm, purchased large inventories of chips that were in short supply. When chip manufacturers drastically reduced the price on those chips Dell and Palm wrote down their inventories. Similarly, when demand for Intel's prod- ucts decline, Intel must write down its inventories. Firms also write down damaged goods, and the fashion industry will write down goods toward the end of a season, when items may sell for less than their cost. Under IFRS, inventories must be written down to lower of cost or "net realisable value" (IAS 2, par. 28), where net realisable value is defined as: Net realisable value refers to the net amount thot an entity expects to realize from the sale of inventory in the ordinary course of business. Fair value reflects the amount for which the same inventory could be exchanged between knowledgeable and willing buyers and sellers in the marketplace. The former is an entity-specitic ealue; the katter is not. Net realizable value for inventories may not equal lair value less costs to sell (IAS 2, par. 7) Suppose a retailer using IFRS buys a television from its supplier for $325 and ex pects to sell the television for $425. A week later the supplier drops the price to $275 and in response, the retailer drops its retail price to $375. If the retailer's selling cost is $35, its net realizable value will be $340 ($375 selling price, less $35 selling cost). Its $340 net realizable value is greater than its $325 cost, so the retailer would continue Here is a typical IFRS inventory disclosure from The Swatch Group's 2008 annual report Inventories are stated at the lower of cost and net realizable value. Cost is determined using the weighted average price method Some companies, particukarly those in the Pro- duction segment, value their inventories using the standard cost method As these costs are regularly reviewed ond adjusted, this method approximates the results of the weighted average price method. The valuation of spare pants for customer service is confined to to value the item at its $325 original cost. those unaits that ane considered likely to be used, based on historical demand Net realizable value is the estimated selling price in the ordinary course of business less estimated costs of completion and the applicable variable seling expenses Under U.S GAAP, inventory is written down to the lower of cost or market, but the market is subject to both a celing and a loor. The ceiling is net realizable value, and the floor is net realizable value lessa.normal profi margin. In most cases, the differ- ences between U.S. GAAP and IFRS lower of cost or market rules are minimal they Firms are required to disclose inventory write aat a n downsare soen provide limited information about the w wintr articularly common at firms that sell seasonal oo or swim suits. They are also common at technologych els semiconductors has increased by about 50% every 18 monmb so Intel continually introduces new products, which make obso Because the cost of Intel products declines rapidly, and beca new products every quarter, Intel probably has inventory write n many quarters, the write-downs have been significant enou some disclosure. In other quarters, Intel only disclosed that thugh to mey the valuation of obsolete or excess inventory, Most of Intel's 10-ie statement similar to the following from Intel's first quarter 20090 the price of older products as prices drop rapidly he world's leading semiconductor producer. The cause l orts con Condition and Results of Operations Inventory Management Discussion and Analysis of Financi The valuation of inventory requires us to estimate obsolete or excess ine as inventory that is not of saleable quality. The derenmination of obsolet inventory requires us to estimate the future demand for our products. The or excess estimate o levels to determine the amount, if any, of obsolete or excess inventory. As of March 28 l had total work-in-process inventory of $1,448 million and total finished of $1,217 million. The demand forecast is included in the development of oursory manufacturing plans to enable consistency between inventory valuation cisions. Product-specific facts and circumstances reviewed in the invento process include a review of the customer base, the stage of the product life an assessment of the selling price in relation to the product cost. If our dem cycle of fidence, and customer acceptance of our products, as wel our products, consumer con for specific products is greater than actual demand and we fail to reduce manufacturine output accordingly, or if we fail to forecast the demand accurately, we could be requiresd to write off inventory, which would negatively impact our gross margin. Notes to Consolidated Condensed Financial Statements-Unaudited Note 6: Inventories Inventories at the end of each period were as follows: March 28, 2009 $380 1,448 1,217 $3,045 Dec. 27, (In millions) Raw materials Work in process Finished goods Total inventories 2008 $608 1,577 1,559 $3,744 CASE 3. INTEL CORPORATION AND INVENTORY WTHows The valuation of inventory requires us to estimate obsolete or excess inventory as uel as inventory that is not of saleable quality. The determination of obsolete or excess inventory requires us to estimate the future demand for our products. It is reasonably possible that our estimate of future demand for our products could change in the near term and result in additional inventory write-offs, which would negatively impact our gross margin. Exhibit 1 summarizes Intel's deferred tax asset from inventory Intel must record n inventory write-down expense for financial reporting but is not allowed to report inventory write-downs for tax reporting. For example, suppose Intel wrote inventory down by S1O0 million in 02 2009. Also suppose Intel was subject to an average in come tax rate of 30%. For financial reporting, Intel would record the following entry to write down inventory: Cost of sales-inventory write-down $100,000,000 Allowance for obsolete inventory $100,000,000 Because this reduces reported financial accounting income by $100 million, it will reduce the provision for income taxes (income tax expense) by $30 million (because of the 30% tax rate). However, because this does not reduce income taxes payable to the IRS, the offsetting debit will be to deferred tax assets, not to taxes payable Deferred tax assets $30,000,000 $30,000,000 Provision for income taxes As a result, when Intel's deferred tax asset for inventory valuation in Exhibit 1 increases by $30 million, Intel has increased its allowance for obsolete inventory by about $100 million. Exhibit 2 shows all of Intel's 10-Q inventory write-down disclosures from Q1 1996 through Q3 2009, except for the general statement that inventory write-downs require estimates. Over the years, some analysts suggested that Intel may use excessive inventory write-downs to lower net income in quarters when profit is higher than expected. In subsequent quarters, when profit is lower than expected, those analysts suggested that Intel might sell the written-down inventory at abnormally high profit margins to increase reported profits. Required 1. Evaluate this statement from Intel's Q1 2004 10-Q footnote disclosure (Exhibit 2): In addition, Q1 2003 benefited from the unusually high level of sales of microprocessor and chipset inventory that had been previously reserved." Evaluate this statement from Intel's Q2 2007 10-Q footnote disclosure: "Sales of offset the effect of the revenue declin e0 microprocessor inventory that had been previously written off further uate this statement from Intel's Q2 2008 10-Q: These increases were partialy aset by sales in the first half of 2007 of desktop microprocessor had been previously written off 4. How Explanuch flexibility does Intel have in writing down excess inventories? Explain. 5. Ev quality of the inventory disclosures in Exhibit 2 Taxes note to Intel Corn' The following deferred tax assets are taken from the reports. They are the deferred tax asset that results from inventory write-down nnual 10- reporting purposes that were not yet allowed for tax reporting (inventory write or financ not permitted for tax reporting until the written-down inventory is sold toahae destroyed) EL CORP 08 10-K TAX OTNOTE inventory write-down depends on the cumulative amount reporting that has not been written off for tax purposes, adjusted which has averaged about 30% over the past two decades. Thean r Intel's et for financial reporting purposes but not for tax purposes is as its deferred tax asset for inventory reserves. written off for financial for Intel's effective two decades. The amount Intel has off as large DEFERRED TAX ASSET, INVENTORY VALUATION 1994 1995 1996 1997 1998 1999 Millions $255 104 $187 $163 $106 $120 $209 $184 $156 $193 $251 $268 $315 $602 2001 2002 2003 2004 10-Q INVENTORY WRITE-DOWN DISCLOSURES 1996 Cost of sales rose by 50% from Q1 1995 to Q1 1996 primarily due to increased unit dins Gross margin declined from 55% in Q1 1995 to 48% in Q1 1996 due primany to incresed sales of Pentium processor related board level products at lower margins, factory stat costs and inventory reserves, including continuing reserves related to invertres S, 1996 purchased components Cost of sales rose by 19% from Q2 1995 to Q2 1996, primarily due to ne ryges Gross margin was 53% in Q2 1996 versus 54% in Q2 1995, Although percentage had been declining since 02 1995, it returned to theening to the prior year's level prinanily de er memory inventory write offs than the Company has been EXHIBIT 2- of sales d eclined by 5% from Q1 1996 to Q1 1997 due to shifts inp INTEL CORP. factory efficiencies due to increased volume. Costs for Q1 of 1996lirchased inventory reserves, including reserves r NVENTORY WRITE-DOWN DISCLOSURES, TO Q3, 2009 components. Gross margin increased dua unusually o included related to from 48% in Q1 1996 to more favorable product mix and the reduced costs inventories of 64% in Q1 1997 due to tne discussed above. 1998 02 Cost of sales increased by 29% from 02 1997 to 02 1998 due to the shift in product is toe the Pentium(R) II processor, reflecting the cost of purchased components for the Singte Contact ("SEC") cartridge, higher unitvolumes, and higherfixed costs. In addition, in 2 I e Edge 1998 reductions in product costs on the highest volume processors caused invn in Q2 1997 primarily due to the lower processor prices, the impact of the SEC cartridge, u written down to the new lower costs. Gross margin decreased to 49% in Q2 1998 from 61% inventory write-downs and higher fixed costs. 1999 02 | Cost of sales decreased by 8% in Q2 1999 compared to O2 1998 primaril unit costs for microprocessors in 02 1999 partially offset by higher unit s addition, cost of sales in 02 1998 included unusually high inventory write-downs. The lower unit costs in Q2 1999 were achieved primarily through redesigned microprocessor products with lower-cost as factory efficiencies and lower purchase prices on the purchased components. The gross margin percentage increased to 59% in Q2 1999, up from 49% in Q2 1998. The improvement in gross margin was primarily a result of lower unit costs in the Intel Architecture Business Group operating segment in 02 1999, as well as the absence of the unusually high inventory write-downs recognized in 02 1998, partially offset by the impact of lower prices in 02 1999 due to lower ales volumes. I packaging, including packaging using fewer purchased components, as we 1 03 Cost of sales decreased by 3% in the first nine months of 1999 compared to the first nine months of 1998. In the Intel Architecture Business Group operating segment, lower unit costs for microprocessors in the first nine months of 1999 and the absence in 1999 of the unusually high inventory write-downs recognized in the first nine months of 1998 were partially offset by higher unit sales volumes in the first nine months of 1999. 2001 Although the total cost of sales increased 8% in Q1 2001 compared to Q1 2000, the cost of sales within the Intel Architecture Group operating segment decreased slightly for the same period. The decrease was primarily due to lower sales volume as well as lower unit costs of microprocessors as a result of lower cost packaging. partially offset by increased start-up costs related to 300-millimeter wafer manufacturing and 0.13-micron process technology Within the "all other" c volume of flash memory and the impact of higher inventory reserves in the flash networking and communications businesses more than offset the decreased costs fro Intel Architecture Group. ategory for segment reporting, higher costs due to higher sales (continued) 02 02 2001 compared to 02 2 the same pero was offset by a higher Total cost of sales was essentially flat in within the Intel Architecture Group operating segment was also flat fos and the sales volume of microprocessors Lower cost of sales due to a lower average cost per unit and higher start-up costs related to the 0.13-micron of sales increased slightly primarily due to the impact gory for in the flash memory and networking and communications busi VN ramp and 300-millimeter wafer manufact reserves by the impact of lower unit volumes 03 Es, 1996 fer manufacturing. Within the "all otherTon proc businesses, partiaily Net operating results decreased by $683 million to a loss of $236 million in months of 2001 from a profit of $447 million in the first nine months of 2 the irst to the impact of underutilized factory capacity, lower flash memory unit sales Primarily volumme and higher inventory reserves 2002 with a loss of $150 million in 01 2002 compared to a loss of $153 million in o eflat, compared to Despite the decline in net revenues for ICG, net operating results were approxi 1 2001. was primarily due to the impact of lower inventory write-downs in 01 2002 higher-than-normal write- downs in Q1 2001, as well as lower operating expenses, offet h the impact of lower revenues across all product lines in 01 2002 02 Our gross margin percentage decreased to 47% for Q2 2002 from 48% in Q2 2001, prima due to the Web hosting business wind down charge. Excluding the impact of this charge, the gross margin percentage increased to 49%, primarily due to better overall factory ca utilization and lower ICG inventory write-downs in Q2 2002, compared to higher than n ICG inventory write-downs in 02 2001. pacity normal 03 Cost of sales for the first nine months of 2002 was approximately flat compared to the first nine months of 2001. In the Intel Architecture business, lower start-up manufacturing costs were more than offset by higher costs related to significantly higher volumes and higher unit costs of microprocessors, including microprocessors for the Microsoft Xbox. Cost of sales was lower due to the impact of lower unit volumes in ICG, as well as lower inventory write-downs for both ICG and WCCG. 2003 01 Operating income increased to $1,913 milion in 01 2003, compared to $1,802 million in 01 2002. The increase was primarily due to the 01 2002 impact of a charge of $155 million related to a setlement agreement with Intergraph Corporation and, in Q1 2003, her iet volumes of microprocessors and an unusually high level of sales of microprocessor a inventory that had previously been reserved. cont INTEL CORP. QUARTERLY INVENTORY WRITE-Down DISCLOSURE To Q3, 200 02 The operating loss increased to $143 million in 02 2003 from a $127 million loss in Q2 2002 imarily due to the mix shift to lower-margin wired Ethernet connections. In the ue current ment, sales of wireless Ethernet connections sold in conjunction with competitive environ arocessors and chipsets comprising the Intel Centrino mobile technology also increased the onerating loss. These negative impacts were partially offset by lower inventory write-down as well as lower operating expenses in 02 2003 as we continued our efforts to streamline rations and refocus on our core strategic areas ope 2004 01 Opera ting income increased $1.1 billion, or 58%, in Q1 2004 compared to Q1 2003. The increase was primarily due to the impact of higher revenue and lower unit costs for microprocessors. These increases were partially offset by a $162 million charge in Q1 2004 relating to a settlement agreement with Intergraph Corporation. In addition, 01 2003 benefited from the unusually high level of sales of microprocessor and chipset inventory that had been previously reserved. 02 The operating loss decreased to $126 million in 02 2004, from a loss of $255 million in 02 2003. Higher revenue, as well as the absence of costs incurred in 02 2003 for underutilized factory capacity for flash memory products, improved the operating results. In addition, due to improved demand, sales of flash memory product inventory that had been previously reserved contributed to the lower operating loss. These improvements were partially offset by higher costs for flash memory products as we sold higher density products, as well as the impact cf higher inventory write-offs primarily for certain applications and cellular processors. 03 Operating income decreased $109 million, or 4%, in Q3 2004 compared to Q3 2003, The decrease was primarily due to higher operating expenses as well as higher inventory write downs, partially offset by higher revenue from sales of microprocessors (see "Operating Expenses" below for further discussion on operating expense fluctuations). 2006 01 | 0perating income decreased $1.0 billion, or 42%, in Q1 2006 compared to Q1 2005, The significant decrease was primarily due to lower microprocessor revenue, the impact of d write-downs of chipset inventory and higher operating expenses. These decreases were partially offset by approximately $190 milion of lower start-up costs in 01 200e 02 0perating income decreased $250 million, or 11% in the first half of 2006 compared to the first half of 2005. The decline was primarily caused by an increase in operating expenses, and to a lesser extent, higher write-down of inventory. A majori ty of the decline was offset by the effects of higher revenue, and to a lesser extent, by approximately $170 start-up costs in the first half of 2006. million of lower continued 16 SECTION THREE FINANCIAL Operating income decreased by S 178 million, or 9%, in the first half of 2007 first half of 2006. 7 HIBIT 2- 2007 02 the revenue rechnology, as well as approximately $180 million of higher factory undeour 45-nm e dechi were offset by lower operating expenses. Sales of desktop microprocessor been previously written off further o ARTERLY ENTORY UTE-DOWN t half of 2006. The decrease in operating income was primarily due to tb comp that ha 180 es of Approximately $400 million of higher stam million of higher factory underutiizaton Proces ine. tely $400 million of higher start-up costs, primarily related torevenue of the SE 1996 03, 2009 previously written off further offiet the effect of the revenue declinevory 2008 lower in the first quarter of 2008 as 01 our Gross margin as a percentage of revenue was to the fourth quarter of 2007 as a result of lower mi write-offs, (and] higher microprocessor unit costs as we transition to productsusev 45-nm process technology, and higher start-up costs associated with that transit related due to Operating income decreased by $197 million, or 14%, in Q1 2008 compared to Q1 20 of to process development and advertising. Higher chipset unit costs and sales in O offs mobility microprocessor inventory that had been previously written off were more by lower microprocessor unit costs and higher microprocessor and chipset revenue 02 Operating income increased by $1.7 billion, or 100%, in the first half of 2008 compared to the first half of 2007. The increase in operating income was primarily due to higher microprocessor revenue and approximately $330 million of lower start-up costs, p related to our 45-nm process technology. Lower unit cost for microprocessors and chinsets and $180 million of lower factory underutilization charges also contributed to the increase in operating income. These increases were partially offset by sales in the first half of 2007 of desktop microprocessor inventory that had been previously written off. 2009 03 Our gross margin percentage for the third quarter compared to the second quarter was positively impacted by higher microprocessor sales volume, lower microprocessor underutilization charges, and lower startup costs as we transition into producticn using our unit costs, lower factory 32-nm process technology. These improvements to our gross margin percentage were partialy offset by inventory write-offs of our new 32-nm microprocessor products that were not yet qualified for sale. As we move into the fourth our gross margi and lower factory underutilization charge quarter we expect our gross margin percentage to e further as 32-nm products built in the fourth quarter are qualified for sale. In additon. n percentage is expected to increase due to higher microprocessor sales volume s on increased production