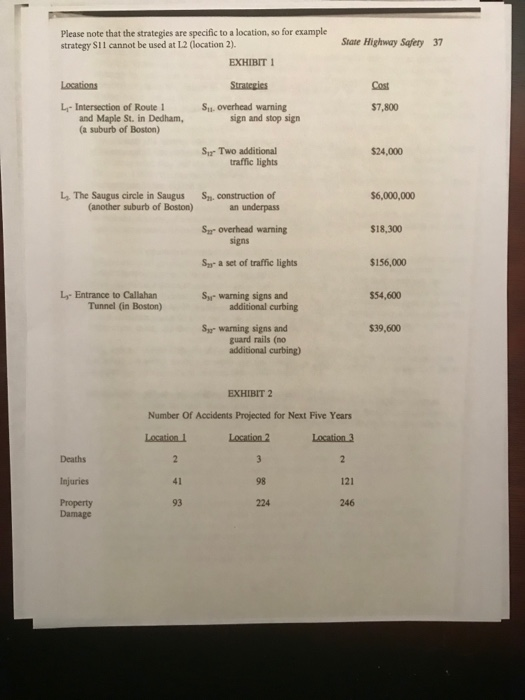
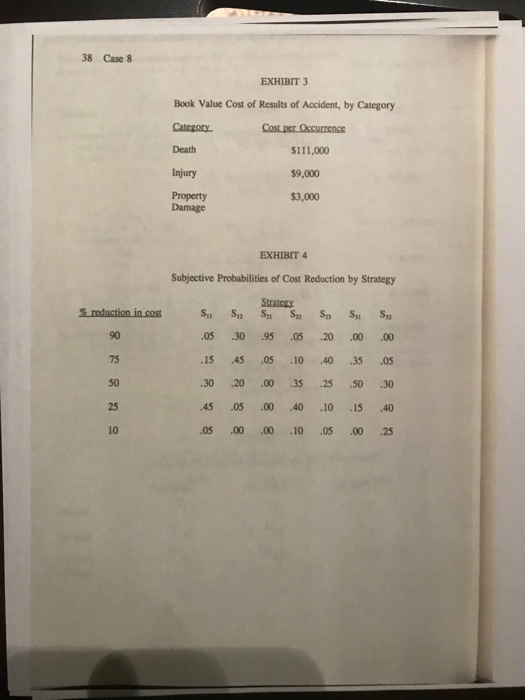
CASE 8 STATE HIGHWAY SAFETY "How do we decide which location offers the most savings? And, how do we decide which of the available strategies to implement at that location?" That was the question under discussion during the meeting of the director of the State Public Works Department, Clint Hill, and his subordinates. Clint was referring to a decision he had to make; he had authorization to choose one remaining location at which to implement a "highway improvement project." This meant that he could pick one location and arrange to allocate a crew of men and whatever expenditures of money were necessary for the restructuring of the traffic pattern in order to reduce the number of traffic accidents that take place at the location. This restructuring could range from a series of warning signs or new traffic lights, to building a new traffic circle or underpass. "Well," noted Gord Tipper, Clint's political liaison, "whatever we choose, we better have documented support for the choice. I know at least three state senators and representatives who will be 'all over us if we don't choose the location in their district." "We will have the support," chimed in Duke Michaels, the head of the information system group. "We have a report of all the high accident locations under our jurisdiction. As you know, these are the locations at which there are more than fifteen major accidents during the previous year. A major accident is defined as one that involves either a death, a serious injury, or property damage exceeding $500. There are three that stand out from the rest. Even the politicians would have to agree that our choice must be one of these three locations." "And," added Benson Lloyd, chief traffic engineer, "I have compiled a list of the various improvement options able to be implemented at each of those three high accident locations. Each option is, in a sense, a different strategy', in that each strategy will lead to a different amount of accident reduction, and, correspondingly, will cost a different amount. Here's a list of the three locations, the different possible strategies at each location, and the cost of implementing each strategy. (See Exhibit 1). What's not so clear are the benefits to be derived by adopting the various strategies at cach location." "What I do know are the number of accidents at each of the three locations the past few years. By examining population trends and trends in the number of accidents of various types in Massachusetts, I've worked out a projection for what I believe will be the number of accidents occurring during the next five years if no change is made at the locations. I think that a five year time horizon is reasonable for our decision making process. After five years the demographic and employment pattern could be so different that I would not want to speculate on the traffic patterns that will exist then. (See Exhibit 2). Of course, one problem yet to be addressed is how we assign a dollar cost to each accident, or a dollar saving from preventing an accident? Can we legitimately do that?" Clint looked at Gord, saying, "Gord, you're the politician in the group. How do we put a dollar cost on a death? We don't want to be insensitive about this; clearly, to the grieving relatives, no 35 36 Case 8 cost can be assigned to a death. Yet, we need to come up with some dollar value that can be justified. Otherwise, we can't do the legally required quantitative analysis to justify what strategy to implement at what location. I can just see a state representative arguing how the location in his or her district should be addressed because while fewer accidents occur, more deaths occur, yet, at the same time another representative is arguing just the opposite: how the location in his or her district should be addressed because many more accidents occur there than in a competing location." "Don't worry! I have an idea," responded Gord. "Let's use the latest figures used by the Federal Government. I have a memo on my desk. It's a copy of a directive to all Federal agencies, mandating what they call the "book values to be assigned to Death, Injury, and Property Damage. I think the numbers come from some insurance study of the impact to society of these occurrences." (See exhibit 3). "Great idea, Gord." Clint agreed. "Let's use those figures. That leaves us with one other issue to address arly, if we implement a certain strategy at a certain location, not every accident will be eliminated. How effective will the various strategies be?" "I've got that one covered, chief", noted Benson. "I took a poll of all the traffic engineers in the department, and got their view of how much reduction in accident costs will result from the various strategies at each location. I arranged the assessments in a table that considers the probability that a given strategy at a given location will result in a particular percent cost saving (See Exhibit 4). Obviously, nobody knows for sure, but the table represents our best collective thinking. For example, if you implement Strategy 1 at Location 1, there's only a .05 chance that you'll eliminate about 90% of the costs induced by accidents, .15 chance of eliminating about 75% of the costs, .30 chance of eliminating about half of the costs, etc." "OK, folks, smiled Clint, "I think we have all of the information we need to do our analysis. Let's find out which strategy at which location we expect offers the maximum amount of dollar savings." Assignment: prepare a recommendation for which strategy should be implemented at which location. Be sure to include the expected dollar (net) benefit to be gained from this implementation, as well as the details on how this value was derived. State Highway Safery 37 Cost Please note that the strategies are specific to a location, so for example strategy SII cannot be used at L2 (location 2). EXHIBIT 1 Locations Strategies L-Intersection of Route 1 Soverhead warning and Maple St. in Dedham, sign and stop sign (a suburb of Boston) Sur Two additional traffic lights $7,800 $24,000 $6,000,000 Ls. The Saugus circle in Saugus (another suburb of Boston) S. construction of an underpass $18,300 Syr overhead warning signs Sy a set of traffic lights $156,000 $54,600 Ly Entrance to Callahan Tunnel in Boston) Syr warning signs and additional curbing $39,600 Sy warning signs and guardrails (no additional curbing) EXHIBIT 2 Number Of Accidents Projected for Next Five Years Location 1 Location 2 Location 3 Deaths 2 3 2 Injuries 41 98 121 93 224 246 Property Damage 38 Case 8 EXHIBIT 3 Book Value Cost of Results of Accident, by Category Category Cost per Occurrence Death $111.000 Injury $9.000 Property Damage $3,000 EXHIBIT 4 Subjective Probabilities of Cost Reduction by Strategy reduction in cost S. S. Strategy S1 Sa Sa S. S 90 .05 .30 .95 .05 .20 .00 .00 75 .15 .45 .05 .10 .40 .35 .05 50 .30 .20 .00 .35 .25 .50 .30 25 .45 .05 .00 .40 .10 .15 .40 10 .05 .00 .00 .10 .05 .00 .25 CASE 8 STATE HIGHWAY SAFETY "How do we decide which location offers the most savings? And, how do we decide which of the available strategies to implement at that location?" That was the question under discussion during the meeting of the director of the State Public Works Department, Clint Hill, and his subordinates. Clint was referring to a decision he had to make; he had authorization to choose one remaining location at which to implement a "highway improvement project." This meant that he could pick one location and arrange to allocate a crew of men and whatever expenditures of money were necessary for the restructuring of the traffic pattern in order to reduce the number of traffic accidents that take place at the location. This restructuring could range from a series of warning signs or new traffic lights, to building a new traffic circle or underpass. "Well," noted Gord Tipper, Clint's political liaison, "whatever we choose, we better have documented support for the choice. I know at least three state senators and representatives who will be 'all over us if we don't choose the location in their district." "We will have the support," chimed in Duke Michaels, the head of the information system group. "We have a report of all the high accident locations under our jurisdiction. As you know, these are the locations at which there are more than fifteen major accidents during the previous year. A major accident is defined as one that involves either a death, a serious injury, or property damage exceeding $500. There are three that stand out from the rest. Even the politicians would have to agree that our choice must be one of these three locations." "And," added Benson Lloyd, chief traffic engineer, "I have compiled a list of the various improvement options able to be implemented at each of those three high accident locations. Each option is, in a sense, a different strategy', in that each strategy will lead to a different amount of accident reduction, and, correspondingly, will cost a different amount. Here's a list of the three locations, the different possible strategies at each location, and the cost of implementing each strategy. (See Exhibit 1). What's not so clear are the benefits to be derived by adopting the various strategies at cach location." "What I do know are the number of accidents at each of the three locations the past few years. By examining population trends and trends in the number of accidents of various types in Massachusetts, I've worked out a projection for what I believe will be the number of accidents occurring during the next five years if no change is made at the locations. I think that a five year time horizon is reasonable for our decision making process. After five years the demographic and employment pattern could be so different that I would not want to speculate on the traffic patterns that will exist then. (See Exhibit 2). Of course, one problem yet to be addressed is how we assign a dollar cost to each accident, or a dollar saving from preventing an accident? Can we legitimately do that?" Clint looked at Gord, saying, "Gord, you're the politician in the group. How do we put a dollar cost on a death? We don't want to be insensitive about this; clearly, to the grieving relatives, no 35 36 Case 8 cost can be assigned to a death. Yet, we need to come up with some dollar value that can be justified. Otherwise, we can't do the legally required quantitative analysis to justify what strategy to implement at what location. I can just see a state representative arguing how the location in his or her district should be addressed because while fewer accidents occur, more deaths occur, yet, at the same time another representative is arguing just the opposite: how the location in his or her district should be addressed because many more accidents occur there than in a competing location." "Don't worry! I have an idea," responded Gord. "Let's use the latest figures used by the Federal Government. I have a memo on my desk. It's a copy of a directive to all Federal agencies, mandating what they call the "book values to be assigned to Death, Injury, and Property Damage. I think the numbers come from some insurance study of the impact to society of these occurrences." (See exhibit 3). "Great idea, Gord." Clint agreed. "Let's use those figures. That leaves us with one other issue to address arly, if we implement a certain strategy at a certain location, not every accident will be eliminated. How effective will the various strategies be?" "I've got that one covered, chief", noted Benson. "I took a poll of all the traffic engineers in the department, and got their view of how much reduction in accident costs will result from the various strategies at each location. I arranged the assessments in a table that considers the probability that a given strategy at a given location will result in a particular percent cost saving (See Exhibit 4). Obviously, nobody knows for sure, but the table represents our best collective thinking. For example, if you implement Strategy 1 at Location 1, there's only a .05 chance that you'll eliminate about 90% of the costs induced by accidents, .15 chance of eliminating about 75% of the costs, .30 chance of eliminating about half of the costs, etc." "OK, folks, smiled Clint, "I think we have all of the information we need to do our analysis. Let's find out which strategy at which location we expect offers the maximum amount of dollar savings." Assignment: prepare a recommendation for which strategy should be implemented at which location. Be sure to include the expected dollar (net) benefit to be gained from this implementation, as well as the details on how this value was derived. State Highway Safery 37 Cost Please note that the strategies are specific to a location, so for example strategy SII cannot be used at L2 (location 2). EXHIBIT 1 Locations Strategies L-Intersection of Route 1 Soverhead warning and Maple St. in Dedham, sign and stop sign (a suburb of Boston) Sur Two additional traffic lights $7,800 $24,000 $6,000,000 Ls. The Saugus circle in Saugus (another suburb of Boston) S. construction of an underpass $18,300 Syr overhead warning signs Sy a set of traffic lights $156,000 $54,600 Ly Entrance to Callahan Tunnel in Boston) Syr warning signs and additional curbing $39,600 Sy warning signs and guardrails (no additional curbing) EXHIBIT 2 Number Of Accidents Projected for Next Five Years Location 1 Location 2 Location 3 Deaths 2 3 2 Injuries 41 98 121 93 224 246 Property Damage 38 Case 8 EXHIBIT 3 Book Value Cost of Results of Accident, by Category Category Cost per Occurrence Death $111.000 Injury $9.000 Property Damage $3,000 EXHIBIT 4 Subjective Probabilities of Cost Reduction by Strategy reduction in cost S. S. Strategy S1 Sa Sa S. S 90 .05 .30 .95 .05 .20 .00 .00 75 .15 .45 .05 .10 .40 .35 .05 50 .30 .20 .00 .35 .25 .50 .30 25 .45 .05 .00 .40 .10 .15 .40 10 .05 .00 .00 .10 .05 .00 .25