

Question: Case 8 - Wendy Aust, Senior Strategic Analyst, Global Strategy Advisors, LLC 8-1 1 Ms. Wendy Aust celebrated her tenth year at Global Strategy Advisors,
Case 8 - Wendy Aust, Senior Strategic Analyst, Global Strategy Advisors, LLC
8-1
1 Ms. Wendy Aust celebrated her tenth year at Global Strategy Advisors, LLC (GSA) by taking Jim Warren, her newly hired financial analyst, to lunch in Atlanta's swanky Buckhead area to discuss his new job. Jim was excited to have joined GSA, given its impressive reputation as a strategic advisory group headquartered in Atlanta with offices in Boston, Denver, Geneva, and Hong Kong. Jim had just finished his MBA through APEI's American Public University and his CFP through the University of Phoenix after serving in the U.S. Army for three years. He graduated with honors from Georgia Tech in industrial management prior to entering the Army.
2 The lunch gave Ms. Aust an informal chance to give Jim a clearer understanding about the focus strategy at Global Strategy Advisors, which had, she felt, established the foundation of GSA's impressive success since its founding 25 years earlier. That strategy had as its core a commitment to focus on only 10 basic "industries" or business sectors. The specialized expertise developed over time was thought to enable GSA to consistently help client companies become more successful than they were prior to GSA's involvement with them. She smiled as she thought about the assignment she was about to give Jim Warren, remembering back to the time when she was given the exact same assignment when she joined GSA. It was a tradition at Global Strategy Advisors that every new associate was given the assignment during their first week on the job, with that tradition also being to keep the assignment unknown to new hires until that first GSA immersion week, which always took place at GSA's Atlanta headquarters.
3 Once their food arrived, Ms. Aust started by telling Jim about GSA's longtime focus
strategy, sharing numerous stories of how GSA's exceptional sector expertise had helped several large global companies on repeated occasions. The core foundation to absorbing that expertise, she said, was a sound understanding of the financial fundamentals of each sector and various firms that operated in each sector. Jim was aware of some of the top global companies GSA had assisted over the years, but he was a little surprised that a firm with such a global reach would focus only on ten sectors. Ms. Aust then, with a more serious tone in her voice, told Jim that every new associate was given an assignment considered of the utmost importance by the sector directors at Global Strategy Advisors. As she gave Jim an attractive thin brochure, which contained seven sheets of crisp parchment paper, she told Jim of the importance of this exercise in any new associate's future with the firm. She then started to explain the packet. The first page was a welcome message with a list of the ten "industries" or sectors that comprised GSA's strategic focus. The second and third pages contained two similar financial spreadsheets with ten columns, each column containing financial information--balance sheet and a variety of financial ratios--describing one unnamed company and former or current GSA client.
4 The next two pages contained the numbers 1 through 10 with the words "Please explain why?" under each number, and a blank space enough to write a few sentences or bullet points in answer to that question. "ASSIGNMENT A" was listed at the top of these pages.
8-2
The final page listed two additional, related assignments Jim was being given. A copy of what Jim saw is provided below. As Jim thumbed through the pages, Ms. Aust continued , "Jim, you are to complete this assignment this evening and then you will be expected in the boardroom promptly tomorrow morning at 7:30 a.m. for your first meeting with the ten GSA sector directors. After a brief meet and greet, you will be expected to make a presentation to that group answering the questions asked in Assignments A, B and C. This set of assignments and the presentation meeting with the sector directors is one every new GSA associate undertakes during their first week here in the Atlanta headquarters. Those that show a solid intuitive understanding of the basic financial underpinnings of our ten chosen sectors during this first meeting with the sector directors, as well as an intuitive and fact-based ability to explain the often dramatic performance difference between two companies in the same industry, receive an immediate $25K increase in their basic compensation plan. Those associates that don't both forego the compensation increase and, historically, approximately 70 percent will leave GSA within their first two years."
5 Jim tried to remain relaxed as Ms. Aust returned to friendly chatter about her first ten years at GSA, and her anxiety when she was given this assignment. Her expressions of confidence in Jim were minimally reassuring. Later that evening, shortly after Jim got back to his hotel room around the corner from the GSA headquarters, he pulled out the brochure and started to read the assignment in earnest.
ASSIGNMENT FOR MR. JIM WARREN
6 Jim, welcome to Global Strategy Advisors. We are extremely pleased that you have chosen to join us. Global Strategy Advisors focuses exclusively on the follow ten industries as a means of building deep expertise, which in turn has allowed us to build a competitive advantage no other firm can match in the success of our investments, acquisitions, and advisory services. What we started 25 years ago as an experiment has continued to prove perhaps the best indicator of a new associate's future success at quickly contributing to and continuing that result. That experiment was the assignment you will undertake this evening and conclude early tomorrow morning, giving us a clearer view of your intuitive appreciation for the underlying financial dynamics of the industries we serve. It also lets us listen to your rationale and view a presentation of your strategic insights that you think might explain performance differences between two competitors in each industry we serve.
GSA's Fortune 500-Based INDUSTRY CHOICES:
A. Computers
B. Commercial Banks
C. Entertainment
D. Food Services
E. General Merchandise
Financial Information
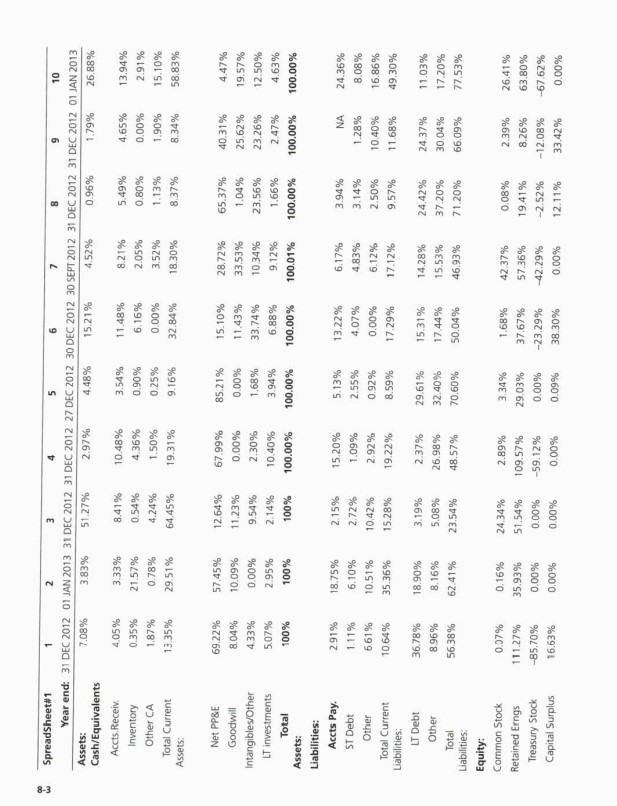
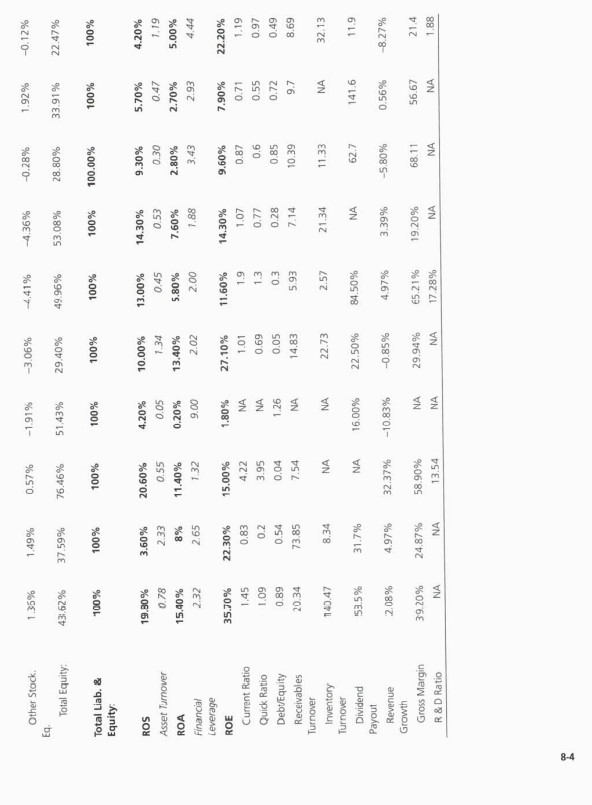
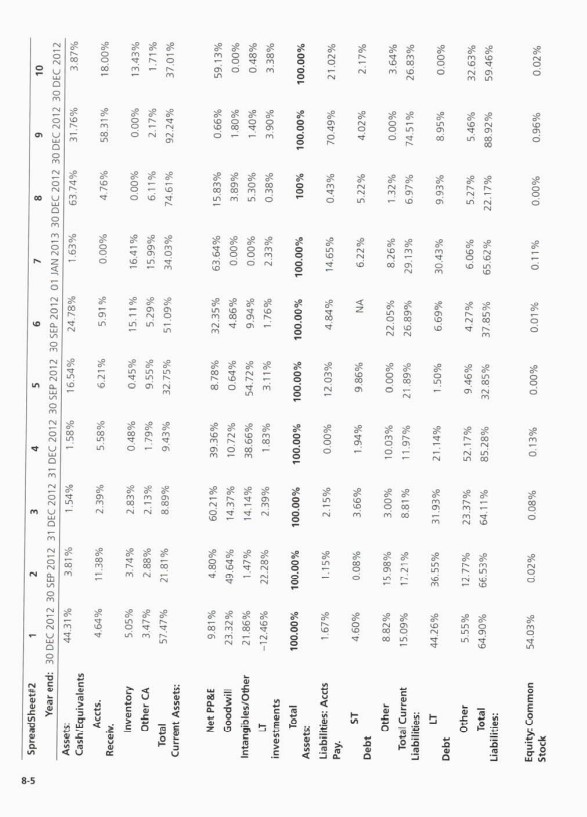
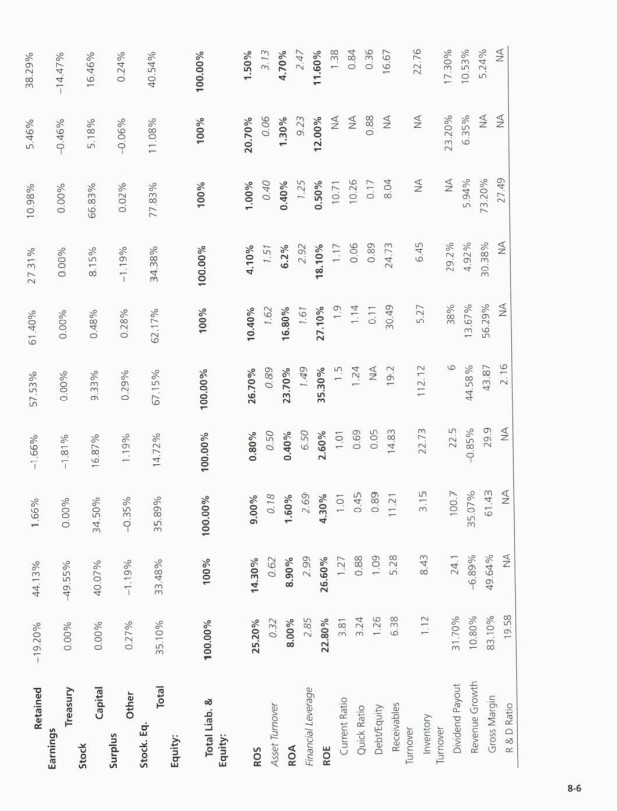
7 Included on the next two pages are Spreadsheets #1 and #2 which contain financial information on two sets of companies that compete in the ten Fortune 500-based industries GSA focuses on. Refer to Chapter 6, Appendix B, "Using Financial Analysis" to refamiliarize yourself with the definition of these ratios and how to interpret them as a helpful primer for this assignment.
8-3
8-4
8-5
8-6
8-7
Assignment A
8 Review the financial information in each spreadsheet, then please list which industry your intuition tells you is associated with the company in each column of data, for each spread-sheet. Make notes or bullet points in the space provided after each number that help explain why you chose to associate each column's data with that particular industry. Do this separately for each spreadsheet.
Sheet 1: Assignment A1 Choosing among the ten Fortune 500-based sectors GSA focuses on, please list the industry you think is best associated with the financial information in each column of Sheet #1:
1. This column is the __________________________- industry, because
2. This column is the __________________________- industry, because
3. This column is the __________________________- industry, because
4. This column is the __________________________- industry, because
5. This column is the __________________________- industry, because
6. This column is the __________________________- industry, because
7. This column is the __________________________- industry, because
8. This column is the __________________________- industry, because
9. This column is the __________________________- industry, because
10. This column is the __________________________- industry, because
Sheet 2: Assignment A2 Choosing among the ten Fortune 500-based sectors GSA focuses on, please list the industry you think is best associated with the financial information in each column of Sheet #1:
1. This column is the __________________________- industry, because
2. This column is the __________________________- industry, because
3. This column is the __________________________- industry, because
4. This column is the __________________________- industry, because
5. This column is the __________________________- industry, because
6. This column is the __________________________- industry, because
7. This column is the __________________________- industry, because
8. This column is the __________________________- industry, because
9. This column is the __________________________- industry, because
10. This column is the __________________________- industry, because
Assignment B
9 What specific financial and ratio information in each spreadsheet leads you to conclude that a particular column is the sector you have concluded it represents? Please prepare to explain your thinking.
Assignment C
10 The senior director [your instructor] will now tell you who the firms are that correspond to each column on both spreadsheets, and their annual sales for the year reported. After receiving this information, please re-compare the financial information for the two firms in each sector, along with your general knowledge about those firms. What additional support
8-8
for your interpretation of differences between the two firms on key ratios or other financial indicators occurs to you? Does the support for your interpretation lessen in any way once you know the firm's name, and annual sales? And, now that you know who the firms are and their sales volume for that column year, does it change what differences in either firm's strategy, tactics, and internal capabilities explain the differences you see between those two firms based on their ratios and financial information in their respective columns? Prepare to explain your points orally and quickly once your senior director [your instructor] gives you the information on which company is associated with which column.
11 Jim grabbed the spreadsheets, made a hot cup of tea, and set them on the kitchen counter to begin preparing for his assignments. He turned to Pearce and Robinson's Chapter 6 , Appendix B, "Using Financial Analysis" to refamiliarize himself with the definition of these ratios and how to interpret them as a helpful primer for this assignment. It was only 9 p.m. so he was confident he had plenty of time to be ready for tomorrow morning. Jim laid out his suit and accessories he'd wear in the morning when he went over to join Ms. Aust for breakfast an hour before the scheduled 7:30 a.m. meeting with the directors. He very quickly returned to the kitchen counter to get started.
1. Instructions/Guidance to Make the Assignment:
- Read the case study. Do the following (as mentioned in the Assignment Template):
- Assignment A - Complete Sheet 1: Assignment A1 ONLY.
Follow the instructions for each column (Page 8-7).
- Assignment B - Complete for Sheet 1: Assignment A1 ONLY.
Be VERY clear on your explanations (Page 8-7). (You can get these industry figures from any source you want, but you MUST cite your source).
2. Assignment Template to Make it Happened:
Wendy Aust, Senior Strategic Analyst, Global Strategy Advisors. LLC
Strategic Analysis
Sheet 1: Assignment A1
- The column is the __________industry, because_________
- The column is the __________industry, because_________
- The column is the __________industry, because_________
- The column is the __________industry, because_________
- The column is the __________industry, because_________
- The column is the __________industry, because_________
- The column is the __________industry, because_________
- The column is the __________industry, because_________
- The column is the __________industry, because_________
- The column is the __________industry, because_________
Assignment B
What specific financial and ratio information in each spreadsheet leads you to conclude that a particular column is the sector you have concluded it represents? (Explain thoroughly)
- The __________financial and ________ratio information concluded that__________
- The __________financial and ________ratio information concluded that__________
- The __________financial and ________ratio information concluded that__________
- The __________financial and ________ratio information concluded that__________
- The __________financial and ________ratio information concluded that__________
- The __________financial and ________ratio information concluded that__________
- The __________financial and ________ratio information concluded that__________
- The __________financial and ________ratio information concluded that__________
- The __________financial and ________ratio information concluded that__________
- The __________financial and ________ratio information concluded that_________
Summary
Give a two-paragraph summary on what you learned by this exercise. (You can use the first person, as I want you to describe YOUR experience). You MUST CITE YOUR SOURCES. Gives REASONS why you chose what you did.
References
This section will reference all original work cited throughout the paper. You must also provide a reference for all sources used to support the case study.
8-3 Spreadsheet#1 1 2 3 4 5 6 7 8 9 10 Year end: 31 DEC 2012 01 JAN 2013 31 DEC 2012 31 DEC 2012 27 DEC 2012 30 DEC 2012 30 SEPT 2012 31 DEC 2012 31 DEC 2012 01 JAN 2013 Assets: 7.08% 3.83% 51.27% 2.97% 4.48% 15.21% 4.52% 0.96% 1.79% 26.88% Cash/Equivalents Accts.Receiv 4.05% 3.33% 8.41% 10.48% 3.54% 11.48% 8.21% 5.49% 4.65% 13.94% Inventory 0.35% 21.57% 0.54% 4.36% 0.90% 6.16% 2.05% 0.80% 0.00% 2.91% Other CA 1.87% 0.78% 4.24% 1.50% 0.25% 0.00% 3.52% 1.13% 1.90% 15.10% 13.35% 29.51% 64.45% 19.31% 9.16% 32.84% Total Current Assets: 18.30% 8.37% 8.34% 58.83% Net PP&E 69.22% 57,45% 12.64% 67.99% 85.21% 15.10% 28.72% 65.37% 40.31% 4.47% Goodwill 8.04% 10.09% 11.23% 0.00% 0.00% 11.43% 33.53% 1.04% 25.62% 19.57% Intangibles/Other 4.33% 0.00% 9.54% 2.30% 1.68% 33.74% 10.34% 23.56% 23.26% 12.50% LT investments 5.07% 2.95% 2.14% 10.40% 3.94% 6.88% 9.12% 1.66% 2.47% 4.63% Total 100% 100% 100% 100.00% 100.00% 100.00% 100.01% 100.00% 100.00% 100.00% 2.91% 18.75% 2.15% 15.20% 5.13% 13.22% 6.17% 3.94% 24.36% 1.11% 6.10% 2.72% 1.09% 2.55% 4.07% 4.83% 3.14% 1.28% 8.08% 6.61% 10.51% 10.42% 2.92% 0.92% 0.00% 6.12% 2.50% 10.40% 16.86% 10.64% 35.36% 15.28% 19.22% 8.59% 17.29% 17.12% 9.57% 11.68% 49.30% 36.78% 18.90% 3.19% 2.37% 29.61% 15.31% 14.28% 24.42% 24.37% 11.03% 8.96% 8.16% 5.08% 26.98% 32.40% 17.44% 15.53% 37.20% 30.04% 17.20% 56.38% 62.41% 23.54% 48.57% 70.60% 50.04% 46.93% 71.20% 66.09% 77.53% 0.07% 0.16% 24.34% 2.89% 3.34% 1.68% 42.37% 0.08% 2.39% 26.41% 111.27% 35.93% 51.54% 109.57% 29.03% 37.67% 57.36% 19.41% 8.26% 63.80% -85.70% 0.00% 0.00% -59.12% 0.00% -23.29% -42.29% -2.52% -12.08% -67.62% 16.63% 0.00% 0.00% 0.00% 0.09% 38.30% 0.00% 12.11% 33.42% 0.00% Assets: Liabilities: Accts Pay. ST Debt Other Total Current LT Debt Other Liabilities: Total Liabilities: Equity: Common Stock Retained Erngs Treasury Stock Capital Surplus 8-4 Other Stack. Eq. Total Liab. & Equity: ROS Asset Turnover ROA Financial Leverage ROE Total Equity: Current Ratio Quick Ratio Debt/Equity Receivables Inventory Turnover Turnover Payout Dividend Revenue Gross Margin R & D Ratio Growth 1.35% 43:.62% 100% 19.80% 0.78 15.40% 2.32 35.70% 1.45 1.09 0.89 20.34 1140.47 53.5% 2.08% 39.20% 1.49% 37.59% 100% 3.60% 2.33 8% 2.65 22.30% 0.83 0.2 0.54 73.85 8.34 31.7% 4.97% 24.87% NA -1.91% 51.43% 100% 4.20% 0.57% 76.46% 100% 20.60% 0.55 11.40% 1.32 15.00% 4.22 3.95 0.04 1.26 7.54 NA NA NA NA 16.00% 32.37% -10.83% 58.90% 13.54 0.05 0.20% 9.00 1.80% NA NA -3.06% 29.40% 100% 10.00% 1.34 13.40% 2.02 27.10% 1.01 0.69 0.05 14.83 22.73 22.50% -0.85% 29.94% NA -4.41% 49.96% 100% 13.00% 0.45 5.80% 2.00 11.60% 1.9 1.3 0.3 5.93 2.57 84.50% 4.97% 65.21% 17.28% -4.36% 53.08% 100% 14.30% 0.53 7.60% 1.88 14.30% 1.07 0.77 0.28 7.14 21.34 NA 3.39% 19.20% -0.28% 28.80% 100.00% 9.30% 0.30 2.80% 3.43 9.60% 0.87 0.6 0.85 10.39 11.33 62.7 -5.80% 68.11 NA 1.92% 33.91% 100% 5.70% 0.47 2.70% 2.93 7.90% 0.71 0.55 0.72 9.7 NA 141.6 0.56% 56.67 NA -0.12% 22.47% 100% 4.20% 1.19 5.00% 4.44 22.20% 1.19 0.97 0.49 8.69 32.13 11.9 -8.27% 21.4 1.88 SpreadSheet#2 1 2 3 4 5 6 7 8 9 10 Year end: 30 DEC 2012 30 SEP 2012 31 DEC 2012 31 DEC 2012 30 SEP 2012 30 SEP 2012 01 JAN 2013 30 DEC 2012 30 DEC 2012 30 DEC 2012 44.31% 3.81% 1.54% 1.58% 16.54% 24.78% 1.63% 63.74% 31.76% 3.87% Assets: Cash/Equivalents Accts. 4.64% 11.38% 2.39% 5.58% 6.21% 5.91% 0.00% 4.76% 58.31% 18.00% Receiv. Inventory 5.05% 3.74% 2.83% 0.48% 0.45% 15.11% 16.41% 0.00% 0.00% 13.43% Other CA 3.47% 2.88% 2.13% 1.79% 9.55% 5.29% 15.99% 6.11% 2.17% 1.71% Total 57.47% 21.81% 8.89% 9.43% 32.75% 51.09% 34.03% 74.61% 92.24% 37.01% Current Assets: Net PP&E 9.81% 4.80% 60.21% 39.36% 8.78% 32.35% 63.64% 15.83% 0.66% 59.13% Goodwill 23.32% 49.64% 14.37% 10.72% 0.64% 4.86% 0.00% 3.89% 1.80% 0,00% Intangibles/Other 21.86% 1.47% 14.14% 38.66% 54.72% 9.94% 0.00% 5.30% 1.40% 0.48% -12.46% 22.28% 2.39% 1.83% 3.11% LT investments 1.76% 2.33% 0.38% 3.90% 3.38% Total 100.00% 100.00% 100.00% 100.00% 100.00% 100.00% 100.00% 100% 100.00% 100.00% Assets: Liabilities: Accts 1.67% 1.15% 2.15% 0.00% 12.03% 4.84% 14.65% 0.43% 70.49% 21.02% Pay. ST 4.60% 0.08% 3.66% 1.94% 9.86% NA 6.22% 5.22% 4.02% 2.17% Debt Other 8.82% 15.98% 3.00% 10.03% 0.00% 22.05% 8.26% 1.32% 0.00% 3.64% 15.09% 17.21% 8.81% 11.97% 21,89% Total Current Liabilities: 26.89% 29.13% 6.97% 74.51% 26.83% LT 44.26% 36.55% 31.93% 21.14% 1.50% 6.69% 30.43% 9.93% 8.95% 0.00% Debt Other 5.55% 12.77% 23.37% 52.17% 9.46% 4.27% 6.06% 5.27% 5.46% 32.63% Total 64.90% 66.53% 64.11% 85.28% 32.85% 37.85% 65.62% 22.17% 88.92% 59.46% Liabilities: Equity: Common 54.03% 0.02% 0.08% 0.13% 0.00% 0.01% 0.11% 0.00% 0.96% 0.02% Stock 8-6 Retained -19.20% Treasury 0.00% Capital 0.00% Other 0.27% 35.10% 100.00% 25.20% 0.32 8.00% 2.85 22.80% 3.81 3.24 1.26 6.38 1.12 31.70% 10.80% 83.10% 19.58 Earnings Stock Surplus Stock. Eq. Equity: Total Liab. & Equity: ROS Asset Turnover ROA Financial Leverage ROE Current Ratio Quick Ratio Debt/Equity Receivables Inventory Dividend Payout Revenue Growth Gross Margin R & D Ratio Turnover Total Turnover 44.13% -49.55% 40.07% -1.19% 33.48% 100% 14.30% 0.62 8.90% 2.99 26.60% 1.27 0.88 1.09 5.28 8.43 24.1 -6.89% 49.64% 1.66% 0.00% 34.50% -0.35% 35.89% 100.00% 9.00% 0.18 1.60% 2.69 4.30% 1.01 0.45 0.89 11.21 3.15 100.7 35.07% 61.43 NA -1.66% -1.81% 16.87% 1.19% 14.72% 100.00% 0.80% 0.50 0.40% 6.50 2.60% 1.01 0.69 0.05 14.83 22.73 22.5 -0.85% 29.9 NA 57.53% 0.00% 9.33% 0.29% 67.15% 100.00% 26.70% 0.89 23.70% 1.49 35.30% 1.5 1.24 NA 19.2 112.12 6 44.58% 43.87 2.16 61.40% 0.00% 0.48% 0.28% 62.17% 100% 10.40% 1.62 16.80% 1.61 27.10% 1.9 1.14 0.11 30.49 5.27 38% 13.67% 56.29% NA 27.31% 0.00% 8.15% -1.19% 34.38% 100.00% 4.10% 1.51 6.2% 2.92 18.10% 1.17 0.06 0.89 24.73 6.45 29.2% 4.92% 30.38% NA 10.98% 0.00% 66,83% 0.02% 77.83% 100% 1.00% 0.40 0.40% 1.25 0.50% 10.71 10.26 0.17 8.04 NA NA 5.94% 73.20% 27.49 5.46% -0.46% 5.18% -0.06% 11.08% 100% 20.70% 0.06 1.30% 9.23 12.00% NA NA 0.88 NA 23.20% 6.35% NA NA 38.29% -14.47% 16.46% 0.24% 40.54% 100.00% 1.50% 3.13 4.70% 2.47 11.60% 1.38 0.84 0.36 16.67 22.76 17.30% 10.53% 5.24% NA 8-3 Spreadsheet#1 1 2 3 4 5 6 7 8 9 10 Year end: 31 DEC 2012 01 JAN 2013 31 DEC 2012 31 DEC 2012 27 DEC 2012 30 DEC 2012 30 SEPT 2012 31 DEC 2012 31 DEC 2012 01 JAN 2013 Assets: 7.08% 3.83% 51.27% 2.97% 4.48% 15.21% 4.52% 0.96% 1.79% 26.88% Cash/Equivalents Accts.Receiv 4.05% 3.33% 8.41% 10.48% 3.54% 11.48% 8.21% 5.49% 4.65% 13.94% Inventory 0.35% 21.57% 0.54% 4.36% 0.90% 6.16% 2.05% 0.80% 0.00% 2.91% Other CA 1.87% 0.78% 4.24% 1.50% 0.25% 0.00% 3.52% 1.13% 1.90% 15.10% 13.35% 29.51% 64.45% 19.31% 9.16% 32.84% Total Current Assets: 18.30% 8.37% 8.34% 58.83% Net PP&E 69.22% 57,45% 12.64% 67.99% 85.21% 15.10% 28.72% 65.37% 40.31% 4.47% Goodwill 8.04% 10.09% 11.23% 0.00% 0.00% 11.43% 33.53% 1.04% 25.62% 19.57% Intangibles/Other 4.33% 0.00% 9.54% 2.30% 1.68% 33.74% 10.34% 23.56% 23.26% 12.50% LT investments 5.07% 2.95% 2.14% 10.40% 3.94% 6.88% 9.12% 1.66% 2.47% 4.63% Total 100% 100% 100% 100.00% 100.00% 100.00% 100.01% 100.00% 100.00% 100.00% 2.91% 18.75% 2.15% 15.20% 5.13% 13.22% 6.17% 3.94% 24.36% 1.11% 6.10% 2.72% 1.09% 2.55% 4.07% 4.83% 3.14% 1.28% 8.08% 6.61% 10.51% 10.42% 2.92% 0.92% 0.00% 6.12% 2.50% 10.40% 16.86% 10.64% 35.36% 15.28% 19.22% 8.59% 17.29% 17.12% 9.57% 11.68% 49.30% 36.78% 18.90% 3.19% 2.37% 29.61% 15.31% 14.28% 24.42% 24.37% 11.03% 8.96% 8.16% 5.08% 26.98% 32.40% 17.44% 15.53% 37.20% 30.04% 17.20% 56.38% 62.41% 23.54% 48.57% 70.60% 50.04% 46.93% 71.20% 66.09% 77.53% 0.07% 0.16% 24.34% 2.89% 3.34% 1.68% 42.37% 0.08% 2.39% 26.41% 111.27% 35.93% 51.54% 109.57% 29.03% 37.67% 57.36% 19.41% 8.26% 63.80% -85.70% 0.00% 0.00% -59.12% 0.00% -23.29% -42.29% -2.52% -12.08% -67.62% 16.63% 0.00% 0.00% 0.00% 0.09% 38.30% 0.00% 12.11% 33.42% 0.00% Assets: Liabilities: Accts Pay. ST Debt Other Total Current LT Debt Other Liabilities: Total Liabilities: Equity: Common Stock Retained Erngs Treasury Stock Capital Surplus 8-4 Other Stack. Eq. Total Liab. & Equity: ROS Asset Turnover ROA Financial Leverage ROE Total Equity: Current Ratio Quick Ratio Debt/Equity Receivables Inventory Turnover Turnover Payout Dividend Revenue Gross Margin R & D Ratio Growth 1.35% 43:.62% 100% 19.80% 0.78 15.40% 2.32 35.70% 1.45 1.09 0.89 20.34 1140.47 53.5% 2.08% 39.20% 1.49% 37.59% 100% 3.60% 2.33 8% 2.65 22.30% 0.83 0.2 0.54 73.85 8.34 31.7% 4.97% 24.87% NA -1.91% 51.43% 100% 4.20% 0.57% 76.46% 100% 20.60% 0.55 11.40% 1.32 15.00% 4.22 3.95 0.04 1.26 7.54 NA NA NA NA 16.00% 32.37% -10.83% 58.90% 13.54 0.05 0.20% 9.00 1.80% NA NA -3.06% 29.40% 100% 10.00% 1.34 13.40% 2.02 27.10% 1.01 0.69 0.05 14.83 22.73 22.50% -0.85% 29.94% NA -4.41% 49.96% 100% 13.00% 0.45 5.80% 2.00 11.60% 1.9 1.3 0.3 5.93 2.57 84.50% 4.97% 65.21% 17.28% -4.36% 53.08% 100% 14.30% 0.53 7.60% 1.88 14.30% 1.07 0.77 0.28 7.14 21.34 NA 3.39% 19.20% -0.28% 28.80% 100.00% 9.30% 0.30 2.80% 3.43 9.60% 0.87 0.6 0.85 10.39 11.33 62.7 -5.80% 68.11 NA 1.92% 33.91% 100% 5.70% 0.47 2.70% 2.93 7.90% 0.71 0.55 0.72 9.7 NA 141.6 0.56% 56.67 NA -0.12% 22.47% 100% 4.20% 1.19 5.00% 4.44 22.20% 1.19 0.97 0.49 8.69 32.13 11.9 -8.27% 21.4 1.88 SpreadSheet#2 1 2 3 4 5 6 7 8 9 10 Year end: 30 DEC 2012 30 SEP 2012 31 DEC 2012 31 DEC 2012 30 SEP 2012 30 SEP 2012 01 JAN 2013 30 DEC 2012 30 DEC 2012 30 DEC 2012 44.31% 3.81% 1.54% 1.58% 16.54% 24.78% 1.63% 63.74% 31.76% 3.87% Assets: Cash/Equivalents Accts. 4.64% 11.38% 2.39% 5.58% 6.21% 5.91% 0.00% 4.76% 58.31% 18.00% Receiv. Inventory 5.05% 3.74% 2.83% 0.48% 0.45% 15.11% 16.41% 0.00% 0.00% 13.43% Other CA 3.47% 2.88% 2.13% 1.79% 9.55% 5.29% 15.99% 6.11% 2.17% 1.71% Total 57.47% 21.81% 8.89% 9.43% 32.75% 51.09% 34.03% 74.61% 92.24% 37.01% Current Assets: Net PP&E 9.81% 4.80% 60.21% 39.36% 8.78% 32.35% 63.64% 15.83% 0.66% 59.13% Goodwill 23.32% 49.64% 14.37% 10.72% 0.64% 4.86% 0.00% 3.89% 1.80% 0,00% Intangibles/Other 21.86% 1.47% 14.14% 38.66% 54.72% 9.94% 0.00% 5.30% 1.40% 0.48% -12.46% 22.28% 2.39% 1.83% 3.11% LT investments 1.76% 2.33% 0.38% 3.90% 3.38% Total 100.00% 100.00% 100.00% 100.00% 100.00% 100.00% 100.00% 100% 100.00% 100.00% Assets: Liabilities: Accts 1.67% 1.15% 2.15% 0.00% 12.03% 4.84% 14.65% 0.43% 70.49% 21.02% Pay. ST 4.60% 0.08% 3.66% 1.94% 9.86% NA 6.22% 5.22% 4.02% 2.17% Debt Other 8.82% 15.98% 3.00% 10.03% 0.00% 22.05% 8.26% 1.32% 0.00% 3.64% 15.09% 17.21% 8.81% 11.97% 21,89% Total Current Liabilities: 26.89% 29.13% 6.97% 74.51% 26.83% LT 44.26% 36.55% 31.93% 21.14% 1.50% 6.69% 30.43% 9.93% 8.95% 0.00% Debt Other 5.55% 12.77% 23.37% 52.17% 9.46% 4.27% 6.06% 5.27% 5.46% 32.63% Total 64.90% 66.53% 64.11% 85.28% 32.85% 37.85% 65.62% 22.17% 88.92% 59.46% Liabilities: Equity: Common 54.03% 0.02% 0.08% 0.13% 0.00% 0.01% 0.11% 0.00% 0.96% 0.02% Stock 8-6 Retained -19.20% Treasury 0.00% Capital 0.00% Other 0.27% 35.10% 100.00% 25.20% 0.32 8.00% 2.85 22.80% 3.81 3.24 1.26 6.38 1.12 31.70% 10.80% 83.10% 19.58 Earnings Stock Surplus Stock. Eq. Equity: Total Liab. & Equity: ROS Asset Turnover ROA Financial Leverage ROE Current Ratio Quick Ratio Debt/Equity Receivables Inventory Dividend Payout Revenue Growth Gross Margin R & D Ratio Turnover Total Turnover 44.13% -49.55% 40.07% -1.19% 33.48% 100% 14.30% 0.62 8.90% 2.99 26.60% 1.27 0.88 1.09 5.28 8.43 24.1 -6.89% 49.64% 1.66% 0.00% 34.50% -0.35% 35.89% 100.00% 9.00% 0.18 1.60% 2.69 4.30% 1.01 0.45 0.89 11.21 3.15 100.7 35.07% 61.43 NA -1.66% -1.81% 16.87% 1.19% 14.72% 100.00% 0.80% 0.50 0.40% 6.50 2.60% 1.01 0.69 0.05 14.83 22.73 22.5 -0.85% 29.9 NA 57.53% 0.00% 9.33% 0.29% 67.15% 100.00% 26.70% 0.89 23.70% 1.49 35.30% 1.5 1.24 NA 19.2 112.12 6 44.58% 43.87 2.16 61.40% 0.00% 0.48% 0.28% 62.17% 100% 10.40% 1.62 16.80% 1.61 27.10% 1.9 1.14 0.11 30.49 5.27 38% 13.67% 56.29% NA 27.31% 0.00% 8.15% -1.19% 34.38% 100.00% 4.10% 1.51 6.2% 2.92 18.10% 1.17 0.06 0.89 24.73 6.45 29.2% 4.92% 30.38% NA 10.98% 0.00% 66,83% 0.02% 77.83% 100% 1.00% 0.40 0.40% 1.25 0.50% 10.71 10.26 0.17 8.04 NA NA 5.94% 73.20% 27.49 5.46% -0.46% 5.18% -0.06% 11.08% 100% 20.70% 0.06 1.30% 9.23 12.00% NA NA 0.88 NA 23.20% 6.35% NA NA 38.29% -14.47% 16.46% 0.24% 40.54% 100.00% 1.50% 3.13 4.70% 2.47 11.60% 1.38 0.84 0.36 16.67 22.76 17.30% 10.53% 5.24% NA
Step by Step Solution
There are 3 Steps involved in it

Get step-by-step solutions from verified subject matter experts