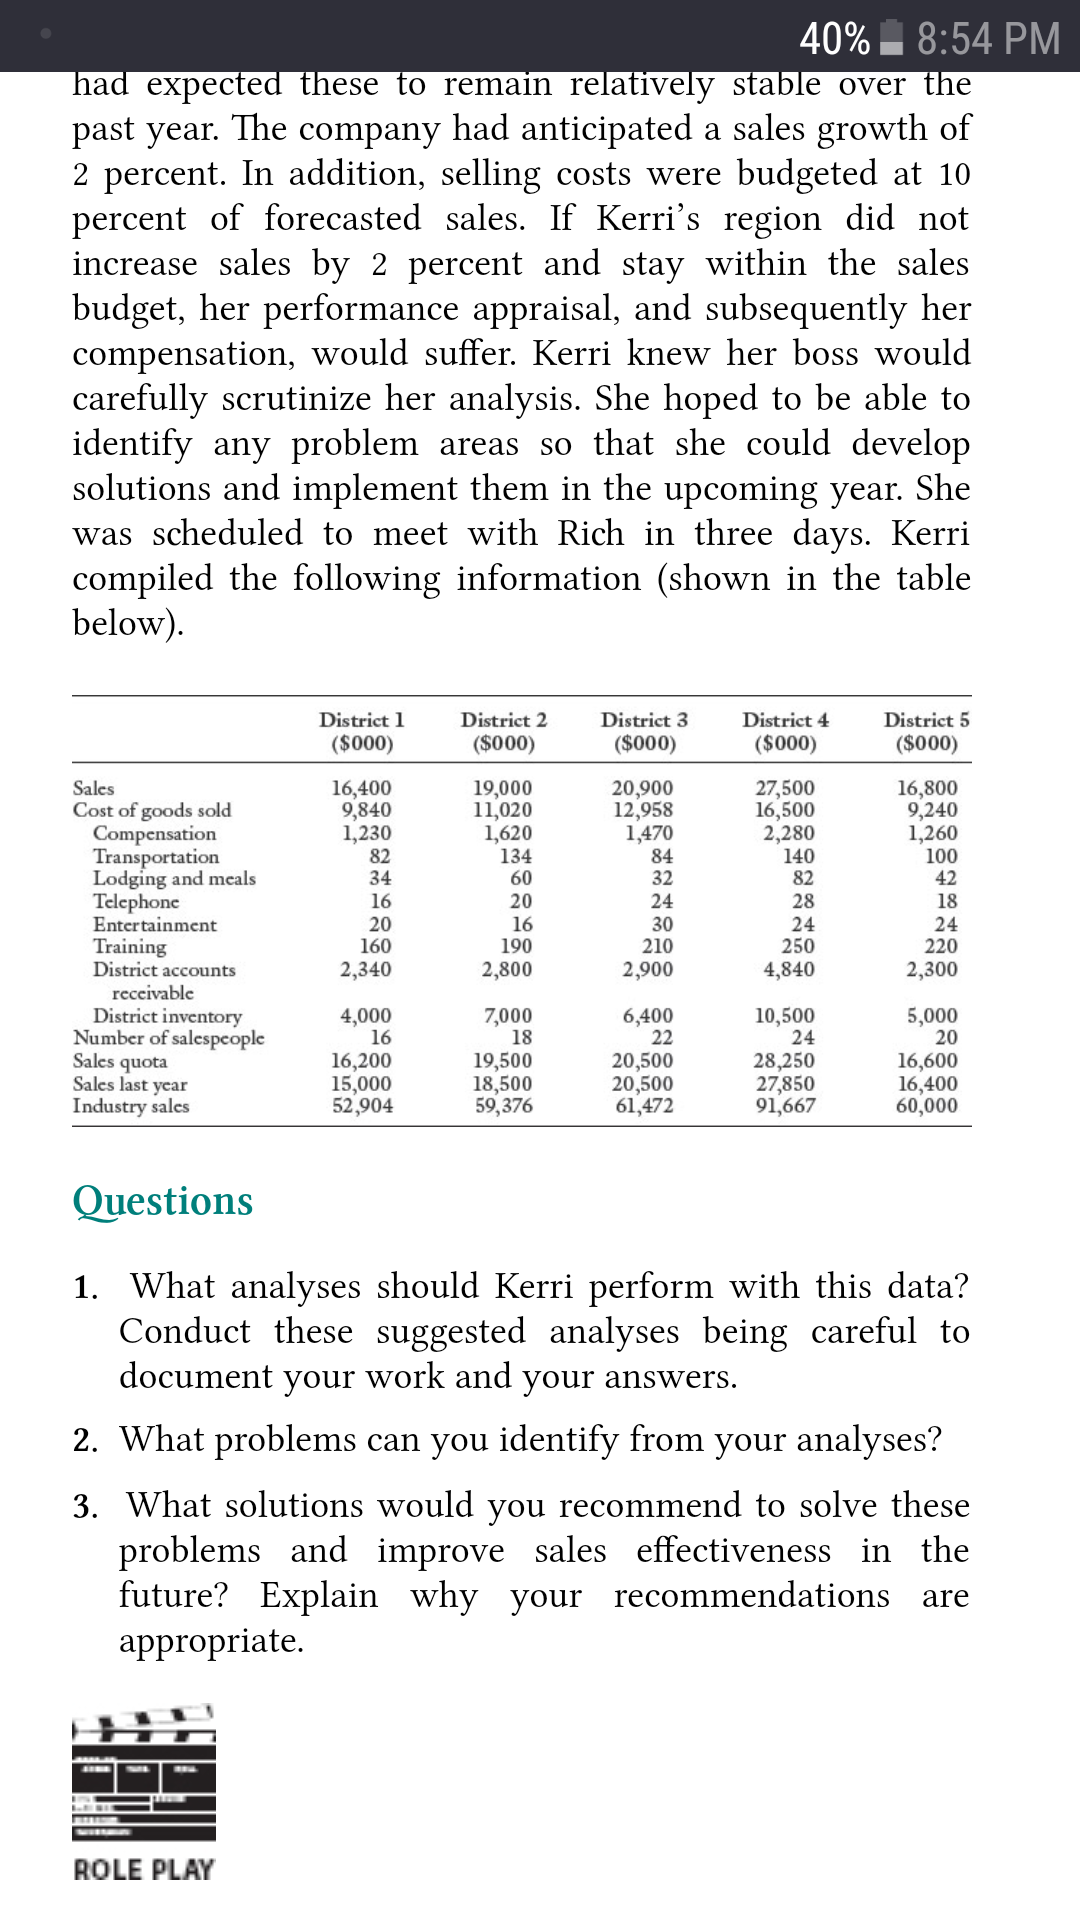
CASE 9.1: ALLIED NOVELTY COMPANY Background Allied Novelty Company markets a broad mix of toys and games to retailers throughout the United States. The salesforce is organized into ve regions, each comprised of ve districts. A national sales executive oversees the ve regional sales managers. Each regional manager is responsible for the effectiveness of his or her region and is compensated according to the achievements of their region. Current Situation Kerri Ross is the northern region sales manager for Allied Novelty. The scal year just ended, and Kerri has compiled data to help her analyze her region's effectiveness. Although her region has had what she believes to be a very successful year, she wants to analyze each district closely. She hopes to use her analysis to identify and correct problems. Moreover, she needs to complete her analysis for her upcoming meeting with her national sales manager, Greg Rich. Market shares for each district were fairly sizable (30 percent, 32 percent, 34 percent, 31 percent, and 28 percent for districts 1 through 5, respectively) at the beginning of the scal year. Kerri had expected these to remain relatively stable over the past year. The company had anticipated a sales growth of 2 percent. In addition, selling costs were budgeted at 10 percent of forecasted sales. If Kerri's region did not increase sales by 2 percent and stay within the sales budget, her performance appraisal, and subsequently her compensation, would suffer. Kerri knew her boss would carefully scrutinize her analysis. She hoped to be able to identify any problem areas so that she could develop solutions and implement them in the upcoming year. She was scheduled to meet with Rich in three days. Kerri compiled the following information (shown in the table below). an expec en ese 0 remam re a we y s a e over e past year. The company had anticipated a sales growth of 2 percent. In addition, selling costs were budgeted at 10 percent of forecasted sales. If Kerri's region did not increase sales by 2 percent and stay within the sales budget, her performance appraisal, and subsequently her compensation, would suffer. Kerri knew her boss would carefully scrutinize her analysis. She hoped to be able to identify any problem areas so that she could develop solutions and implement them in the upcoming year. She was scheduled to meet with Rich in three days. Kerri compiled the following information (shown in the table below). District 1 District 2 District 3 District 4 District 5 ($000) ($000) ($000) ($000) ($000) 5515. 15,400 19,000 20,900 27,500 16,800 Cost of goods sold 9,840 11,020 12,958 16,500 9,240 Compensation 1,230 1,620 1,470 2,280 1,260 Transportation 82 134 84 140 100 Lodging and meals 34 60 32 82 42 Telephone 16 20 24 28 18 Entertainment 20 16 30 24 24 Training 160 190 210 250 220 District accounts 2,340 2,800 2,900 4,840 2,300 receivable District inventory 4,000 7,000 6,400 10,500 5,000 Number of salespeople 16 18 22 24 20 Sales quota 15,200 19,500 20,500 28,250 15,500 Sale: last year 15,000 18,500 20,500 27,850 16,400 Industry sales 52,904 59,375 51,572 91,557 50,000 Questions 1. What analyses should Kerri perform with this data? Conduct these suggested analyses being careful to document your work and your answers. 2. What problems can you identify from your analyses? 3. What solutions would you recommend to solve these problems and improve sales effectiveness in the future? Explain why your recommendations are appropriate. '1' _ _.-=u- _ un non PLAY \"l


