

Question
Case Analysis: Guidelines o Use the Dupont Case Excel Template to compute the ratios in each of the items below. Respond to the discussion questions
Case Analysis: Guidelines o Use the Dupont Case Excel Template to compute the ratios in each of the items below. Respond to the discussion questions in a Word document. Clearly label your answers using the numbers/letters for the Requirements below. Include your name at the top of the document.
Present your answers in complete, well-constructed sentences, and be concise and to the point in your responses. o Save both files using filename: last name_Dupont o Upload your completed files to the Dupont Assignment in Blackboard (Bb). Requirements
1. Compute return on assets (ROA) using the Dupont Analysis approach (see Excel template). Interpret and discuss the overall trends in ROA and each of its components for the five-year period, with an emphasis on the 2014 and 2015 periods.
2. Compute return on equity (ROE) using the Dupont Analysis approach (see Excel template). Interpret and discuss the overall trends in ROE and financial leverage for the five-year period, with an emphasis on the 2014 and 2015 periods. Drill down into the ROA and ROE results by examining core operations and profitability, asset efficiency, and debt financing.
3. Compute the Operations and Profitability (see Excel template).
(a) Discuss the trends over time for the metrics computed.
(b) Has Biogen maintained its gross profit margin over the years?
(c) Discuss the relationship between sales growth and gross margins.
(d) Identify the significant changes that are driving operating margin. What evidence can you find in the case to support the trends in this ratio?
(e) What factors are driving the trends in net profit margin?
(f) What factors are driving the trends in earnings per share?
4. Compute the Asset Efficiency Metrics
(a) Assess short-term operating efficiency over the five-year period.
(b) What recommendations would you suggest to improve the short-term asset efficiency of operations? Relate your suggestions to the impact on the Dupont Analysis.
5. Compute the Debt & Equity Financing and Risk Metrics (see Excel template).
(a) Assess the five-year trends and overall riskiness of the firm over time.
(b) Do you recommend any changes to the structure?
Relate your suggestions to the impact on the Dupont Analysis
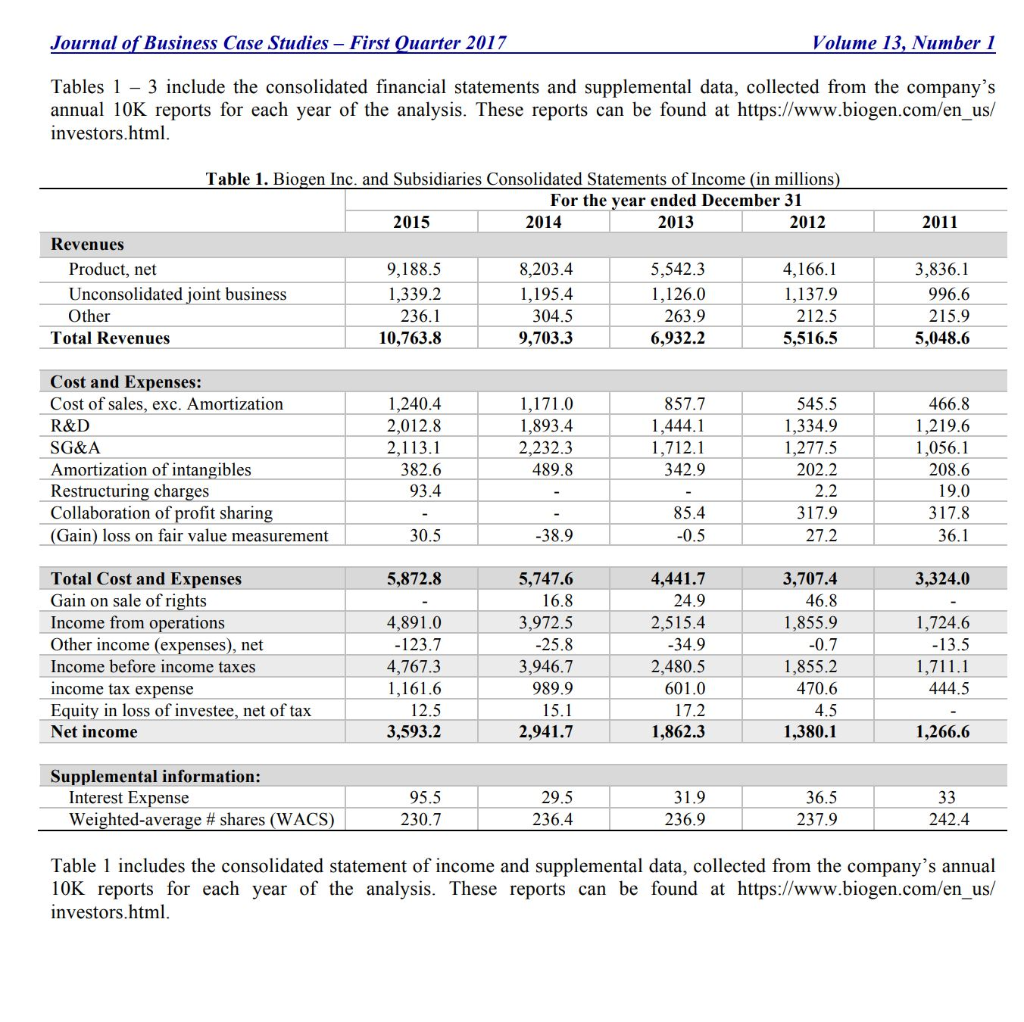
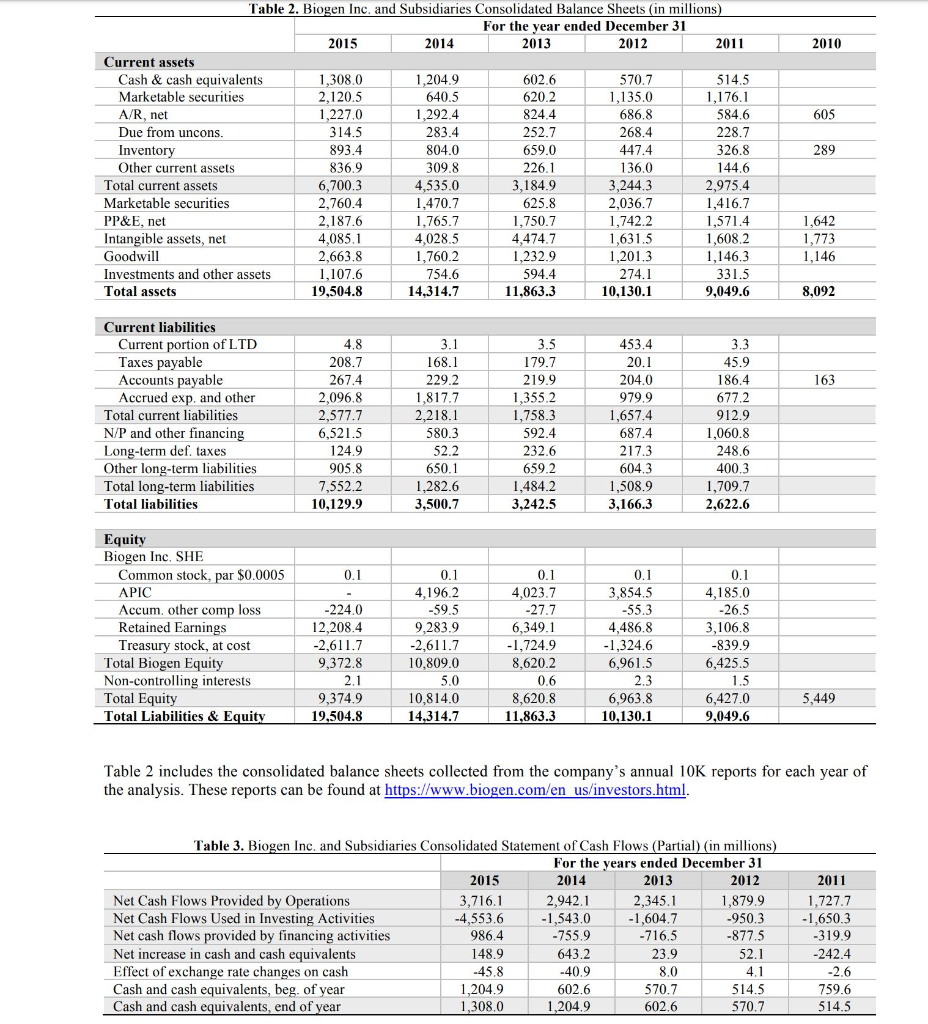
Journal of Business Case Studies - First Quarter 2017 Volume 13, Number 1 Tables 1 3 include the consolidated financial statements and supplemental data, collected from the company's annual 10K reports for each year of the analysis. These reports can be found at https://www.biogen.com/en_us/ investors.html. 2011 Table 1. Biogen Inc. and Subsidiaries Consolidated Statements of Income (in millions) For the year ended December 31 2015 2014 2013 2012 Revenues Product, net 9,188.5 8,203.4 5,542.3 4,166.1 Unconsolidated joint business 1,339.2 1,195.4 1,126.0 1,137.9 Other 236.1 304.5 263.9 212.5 Total Revenues 10,763.8 9,703.3 6,932.2 5,516.5 3,836.1 996.6 215.9 5,048.6 Cost and Expenses: Cost of sales, exc. Amortization R&D SG&A Amortization of intangibles Restructuring charges Collaboration of profit sharing (Gain) loss on fair value measurement 1,240.4 2,012.8 2,113.1 382.6 93.4 1,171.0 1,893.4 2,232.3 489.8 857.7 1,444.1 1,712.1 342.9 545.5 1,334.9 1,277.5 202.2 2.2 317.9 27.2 466.8 1,219.6 1,056.1 208.6 19.0 317.8 36.1 85.4 -0.5 30.5 -38.9 5,872.8 3,324.0 Total Cost and Expenses Gain on sale of rights Income from operations Other income (expenses), net Income before income taxes income tax expense Equity in loss of investee, net of tax Net income 4,891.0 -123.7 4,767.3 1,161.6 12.5 3,593.2 5,747.6 16.8 3,972.5 -25.8 3,946.7 989.9 15.1 2,941.7 4,441.7 24.9 2,515.4 -34.9 2,480.5 601.0 17.2 1,862.3 3,707.4 46.8 1,855.9 -0.7 1,855.2 470.6 4.5 1,380.1 1,724.6 -13.5 1,711.1 444.5 1,266.6 Supplemental information: Interest Expense Weighted average # shares (WACS) 36.5 95.5 230.7 29.5 236.4 31.9 236.9 33 242.4 237.9 Table 1 includes the consolidated statement of income and supplemental data, collected from the company's annual 10K reports for each year of the analysis. These reports can be found at https://www.biogen.com/en_us/ investors.html 2010 605 Table 2. Biogen Inc. and Subsidiaries Consolidated Balance Sheets (in millions) For the year ended December 31 2015 2014 2013 2012 2011 Current assets Cash & cash equivalents 1,308,0 1.204.9 602.6 570.7 514.5 Marketable securities 2,120.5 640.5 620.2 1,135.0 1,176.1 A/R, net 1.227.0 1,292.4 824.4 686.8 584.6 Due from uncons. 314.5 283.4 252.7 268.4 228.7 Inventory 893.4 804.0 659.0 447.4 326.8 Other current assets 836.9 309.8 226.1 136.0 144.6 Total current assets 6,700.3 4,535.0 3,184.9 3,244.3 2,975.4 Marketable securities 2,760.4 1,470.7 625.8 2,036.7 1,416.7 PP&E, net 2,187.6 1,765.7 1,750.7 1,742.2 1,571.4 Intangible assets, net 4,085.1 4,028.5 4,474.7 1,631.5 1,608.2 Goodwill 2,663.8 1,760.2 1,232.9 1,201.3 1,146.3 Investments and other assets 1,107.6 754.6 594.4 274.1 331.5 Total assets 19,504.8 14,314.7 11.863.3 10.130.1 289 1,642 1,773 1,146 9,049.6 8,092 163 Current liabilities Current portion of LTD Taxes payable Accounts payable Accrued exp, and other Total current liabilities N/P and other financing Long-term def. taxes Other long-term liabilities Total long-term liabilities Total liabilities 4.8 208.7 267.4 2,096.8 2,577.7 6,521.5 124.9 905.8 7,552.2 10,129.9 3.1 168.1 229.2 1,817.7 2,218.1 580.3 52.2 650.1 1,282.6 3,500.7 3.5 179.7 219.9 1,355.2 1,758.3 592.4 232.6 659.2 1,484.2 3.242.5 453.4 20.1 204.0 979.9 1,657.4 687.4 217.3 604.3 1,508.9 3,166.3 3.3 45.9 186.4 677.2 912.9 1,060.8 248.6 400.3 1,709.7 2,622.6 0.1 Equity Biogen Inc. SHE Common stock, par $0.0005 APIC Accum. other comp loss Retained Earnings Treasury stock, at cost Total Biogen Equity Non-controlling interests Total Equity Total Liabilities & Equity -224.0 12.208.4 -2,611.7 9.372.8 2.1 9.374.9 19,504.8 0.1 4.196.2 -59.5 9,283.9 -2,611.7 10,809.0 5.0 10,814.0 14,314.7 0.1 4,023.7 -27.7 6,349.1 -1,724.9 8,620.2 0.6 8,620.8 11.863.3 0.1 3,854.5 -55.3 4,486.8 -1,324.6 6,961.5 2.3 6,963.8 10,130.1 0.1 4,185.0 -26.5 3,106.8 -839.9 6,425.5 1.5 6,427.0 9,049.6 5,449 Table 2 includes the consolidated balance sheets collected from the company's annual 10K reports for each year of the analysis. These reports can be found at https://www.biogen.com/en us/investors.html. Table 3. Biogen Inc. and Subsidiaries Consolidated Statement of Cash Flows (Partial) (in millions) For the years ended December 31 2015 2014 2013 2012 Net Cash Flows Provided by Operations 3,716,1 2,942.1 2,345.1 1,879.9 Net Cash Flows Used in Investing Activities -4,553.6 -1,543.0 -1,604.7 -950.3 Net cash flows provided by financing activities 986.4 -755.9 -716.5 -877.5 Net increase in cash and cash equivalents 148.9 643.2 23.9 52.1 Effect of exchange rate changes on cash -45.8 -40.9 8.0 4.1 Cash and cash equivalents, beg. of year 1,204.9 602.6 570.7 514.5 Cash and cash equivalents, end of year 1,308.0 1,204.9 602.6 570.7 2011 1,727.7 -1,650.3 -319.9 -242.4 -2.6 759.6 514.5 Journal of Business Case Studies - First Quarter 2017 Volume 13, Number 1 Tables 1 3 include the consolidated financial statements and supplemental data, collected from the company's annual 10K reports for each year of the analysis. These reports can be found at https://www.biogen.com/en_us/ investors.html. 2011 Table 1. Biogen Inc. and Subsidiaries Consolidated Statements of Income (in millions) For the year ended December 31 2015 2014 2013 2012 Revenues Product, net 9,188.5 8,203.4 5,542.3 4,166.1 Unconsolidated joint business 1,339.2 1,195.4 1,126.0 1,137.9 Other 236.1 304.5 263.9 212.5 Total Revenues 10,763.8 9,703.3 6,932.2 5,516.5 3,836.1 996.6 215.9 5,048.6 Cost and Expenses: Cost of sales, exc. Amortization R&D SG&A Amortization of intangibles Restructuring charges Collaboration of profit sharing (Gain) loss on fair value measurement 1,240.4 2,012.8 2,113.1 382.6 93.4 1,171.0 1,893.4 2,232.3 489.8 857.7 1,444.1 1,712.1 342.9 545.5 1,334.9 1,277.5 202.2 2.2 317.9 27.2 466.8 1,219.6 1,056.1 208.6 19.0 317.8 36.1 85.4 -0.5 30.5 -38.9 5,872.8 3,324.0 Total Cost and Expenses Gain on sale of rights Income from operations Other income (expenses), net Income before income taxes income tax expense Equity in loss of investee, net of tax Net income 4,891.0 -123.7 4,767.3 1,161.6 12.5 3,593.2 5,747.6 16.8 3,972.5 -25.8 3,946.7 989.9 15.1 2,941.7 4,441.7 24.9 2,515.4 -34.9 2,480.5 601.0 17.2 1,862.3 3,707.4 46.8 1,855.9 -0.7 1,855.2 470.6 4.5 1,380.1 1,724.6 -13.5 1,711.1 444.5 1,266.6 Supplemental information: Interest Expense Weighted average # shares (WACS) 36.5 95.5 230.7 29.5 236.4 31.9 236.9 33 242.4 237.9 Table 1 includes the consolidated statement of income and supplemental data, collected from the company's annual 10K reports for each year of the analysis. These reports can be found at https://www.biogen.com/en_us/ investors.html 2010 605 Table 2. Biogen Inc. and Subsidiaries Consolidated Balance Sheets (in millions) For the year ended December 31 2015 2014 2013 2012 2011 Current assets Cash & cash equivalents 1,308,0 1.204.9 602.6 570.7 514.5 Marketable securities 2,120.5 640.5 620.2 1,135.0 1,176.1 A/R, net 1.227.0 1,292.4 824.4 686.8 584.6 Due from uncons. 314.5 283.4 252.7 268.4 228.7 Inventory 893.4 804.0 659.0 447.4 326.8 Other current assets 836.9 309.8 226.1 136.0 144.6 Total current assets 6,700.3 4,535.0 3,184.9 3,244.3 2,975.4 Marketable securities 2,760.4 1,470.7 625.8 2,036.7 1,416.7 PP&E, net 2,187.6 1,765.7 1,750.7 1,742.2 1,571.4 Intangible assets, net 4,085.1 4,028.5 4,474.7 1,631.5 1,608.2 Goodwill 2,663.8 1,760.2 1,232.9 1,201.3 1,146.3 Investments and other assets 1,107.6 754.6 594.4 274.1 331.5 Total assets 19,504.8 14,314.7 11.863.3 10.130.1 289 1,642 1,773 1,146 9,049.6 8,092 163 Current liabilities Current portion of LTD Taxes payable Accounts payable Accrued exp, and other Total current liabilities N/P and other financing Long-term def. taxes Other long-term liabilities Total long-term liabilities Total liabilities 4.8 208.7 267.4 2,096.8 2,577.7 6,521.5 124.9 905.8 7,552.2 10,129.9 3.1 168.1 229.2 1,817.7 2,218.1 580.3 52.2 650.1 1,282.6 3,500.7 3.5 179.7 219.9 1,355.2 1,758.3 592.4 232.6 659.2 1,484.2 3.242.5 453.4 20.1 204.0 979.9 1,657.4 687.4 217.3 604.3 1,508.9 3,166.3 3.3 45.9 186.4 677.2 912.9 1,060.8 248.6 400.3 1,709.7 2,622.6 0.1 Equity Biogen Inc. SHE Common stock, par $0.0005 APIC Accum. other comp loss Retained Earnings Treasury stock, at cost Total Biogen Equity Non-controlling interests Total Equity Total Liabilities & Equity -224.0 12.208.4 -2,611.7 9.372.8 2.1 9.374.9 19,504.8 0.1 4.196.2 -59.5 9,283.9 -2,611.7 10,809.0 5.0 10,814.0 14,314.7 0.1 4,023.7 -27.7 6,349.1 -1,724.9 8,620.2 0.6 8,620.8 11.863.3 0.1 3,854.5 -55.3 4,486.8 -1,324.6 6,961.5 2.3 6,963.8 10,130.1 0.1 4,185.0 -26.5 3,106.8 -839.9 6,425.5 1.5 6,427.0 9,049.6 5,449 Table 2 includes the consolidated balance sheets collected from the company's annual 10K reports for each year of the analysis. These reports can be found at https://www.biogen.com/en us/investors.html. Table 3. Biogen Inc. and Subsidiaries Consolidated Statement of Cash Flows (Partial) (in millions) For the years ended December 31 2015 2014 2013 2012 Net Cash Flows Provided by Operations 3,716,1 2,942.1 2,345.1 1,879.9 Net Cash Flows Used in Investing Activities -4,553.6 -1,543.0 -1,604.7 -950.3 Net cash flows provided by financing activities 986.4 -755.9 -716.5 -877.5 Net increase in cash and cash equivalents 148.9 643.2 23.9 52.1 Effect of exchange rate changes on cash -45.8 -40.9 8.0 4.1 Cash and cash equivalents, beg. of year 1,204.9 602.6 570.7 514.5 Cash and cash equivalents, end of year 1,308.0 1,204.9 602.6 570.7 2011 1,727.7 -1,650.3 -319.9 -242.4 -2.6 759.6 514.5Step by Step Solution
There are 3 Steps involved in it
Step: 1

Get Instant Access to Expert-Tailored Solutions
See step-by-step solutions with expert insights and AI powered tools for academic success
Step: 2

Step: 3
Ace Your Homework with AI
Get the answers you need in no time with our AI-driven, step-by-step assistance
Get Started
The Practice Of Modern Internal Auditing
Authors: Lawrence B Sawyer
1st Edition
B0006C58OA, 978-0894130120