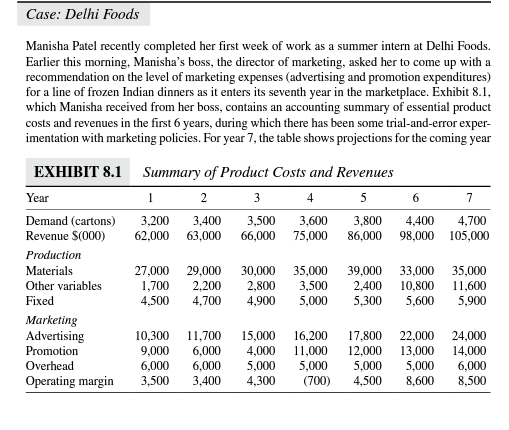
Case: Delhi Foods Manisha Patel recently completed her first week of work as a summer intern at Delhi Foods. Earlier this morning, Manisha's boss, the director of marketing, asked her to come up with a recommendation on the level of marketing expenses (advertising and promotion expenditures) for a line of frozen Indian dinners as it enters its seventh year in the marketplace. Exhibit 8.1, which Manisha received from her boss, contains an accounting summary of essential product costs and revenues in the first 6 years, during which there has been some trial-and-error exper- imentation with marketing policies. For year 7, the table shows projections for the coming year EXHIBIT 8.1 Year Summary of Product Costs and Revenues 1 2 3 4 5 3,200 3,400 3,500 3,600 3,800 4,400 62,000 63,000 66,000 75,000 86,000 98,000 4,700 105,000 Demand (cartons) Revenue S(000) Production Materials Other variables Fixed Marketing Advertising Promotion Overhead Operating margin 27,000 1,700 4,500 29,000 2,200 4,700 30,000 2,800 4,900 35,000 3,500 5,000 39.000 2,400 5,300 33,000 10,800 5,600 35,000 11,600 5,900 10,300 9,000 6,000 3,500 11.700 6,000 6,000 3,400 15.000 4,000 5,000 4,300 16,200 11,000 5,000 (700) 17.800 12.000 5,000 4,500 22.000 13,000 5,000 8,600 24.000 14,000 6,000 8,500 based on a continuation of last year's policy. This includes a new high of $38,000 in marketing expense, but Manisha's boss intimated that this might be excessive. Late last week, Manisha read an internal marketing study that had been completed at Delhi Foods. The study concluded that it is possible to represent the influence of marketing expenses on demand by means of the equation D=AM where D and M represent demand and marketing expenses, respectively, and where a is called the scale factor and b the elasticity of marketing expenses. Manisha knows from courses she has taken that this model belongs to a family of demand equations commonly used in market analysis. To determine values for the parameters a and b that apply to this product, she will have to match this model to the observations as closely as possible. Manisha ponders the information in the table. Costs for the coming year appear to be known; therefore, variable costs have already been estimated. Overhead and fixed production costs do not appear to be variable costs, so they don't enter into a calculation of gross margin Instead, the gross margin is based on revenue, materials costs, and other variable costs. Using the projected figures for the coming year, Manisha expects that she will be able to compute the gross margin per unit. From there, Manisha believes she can represent profit for the line of dinners by using the gross margin per unit along with an estimate of demand to predict this year's gross margin. Then she can subtract marketing expenses and fixed costs to arrive at a profit figure. She sees that marketing expenses show up in her profit calculation, but they also affect her demand estimate. If she can sort out all the relationships in a spreadsheet model, Manisha believes that she can find the optimal level to spend on marketing. Case: Delhi Foods Manisha Patel recently completed her first week of work as a summer intern at Delhi Foods. Earlier this morning, Manisha's boss, the director of marketing, asked her to come up with a recommendation on the level of marketing expenses (advertising and promotion expenditures) for a line of frozen Indian dinners as it enters its seventh year in the marketplace. Exhibit 8.1, which Manisha received from her boss, contains an accounting summary of essential product costs and revenues in the first 6 years, during which there has been some trial-and-error exper- imentation with marketing policies. For year 7, the table shows projections for the coming year EXHIBIT 8.1 Year Summary of Product Costs and Revenues 1 2 3 4 5 3,200 3,400 3,500 3,600 3,800 4,400 62,000 63,000 66,000 75,000 86,000 98,000 4,700 105,000 Demand (cartons) Revenue S(000) Production Materials Other variables Fixed Marketing Advertising Promotion Overhead Operating margin 27,000 1,700 4,500 29,000 2,200 4,700 30,000 2,800 4,900 35,000 3,500 5,000 39.000 2,400 5,300 33,000 10,800 5,600 35,000 11,600 5,900 10,300 9,000 6,000 3,500 11.700 6,000 6,000 3,400 15.000 4,000 5,000 4,300 16,200 11,000 5,000 (700) 17.800 12.000 5,000 4,500 22.000 13,000 5,000 8,600 24.000 14,000 6,000 8,500 based on a continuation of last year's policy. This includes a new high of $38,000 in marketing expense, but Manisha's boss intimated that this might be excessive. Late last week, Manisha read an internal marketing study that had been completed at Delhi Foods. The study concluded that it is possible to represent the influence of marketing expenses on demand by means of the equation D=AM where D and M represent demand and marketing expenses, respectively, and where a is called the scale factor and b the elasticity of marketing expenses. Manisha knows from courses she has taken that this model belongs to a family of demand equations commonly used in market analysis. To determine values for the parameters a and b that apply to this product, she will have to match this model to the observations as closely as possible. Manisha ponders the information in the table. Costs for the coming year appear to be known; therefore, variable costs have already been estimated. Overhead and fixed production costs do not appear to be variable costs, so they don't enter into a calculation of gross margin Instead, the gross margin is based on revenue, materials costs, and other variable costs. Using the projected figures for the coming year, Manisha expects that she will be able to compute the gross margin per unit. From there, Manisha believes she can represent profit for the line of dinners by using the gross margin per unit along with an estimate of demand to predict this year's gross margin. Then she can subtract marketing expenses and fixed costs to arrive at a profit figure. She sees that marketing expenses show up in her profit calculation, but they also affect her demand estimate. If she can sort out all the relationships in a spreadsheet model, Manisha believes that she can find the optimal level to spend on marketing