Answered step by step
Verified Expert Solution
Question
1 Approved Answer
CASE SCENARIO: ALFORD TECHNICAL SERVICES Alford Technical Services surveys real estate to locate property lines and buried utilities for governments, construction companies, and individual landowners.
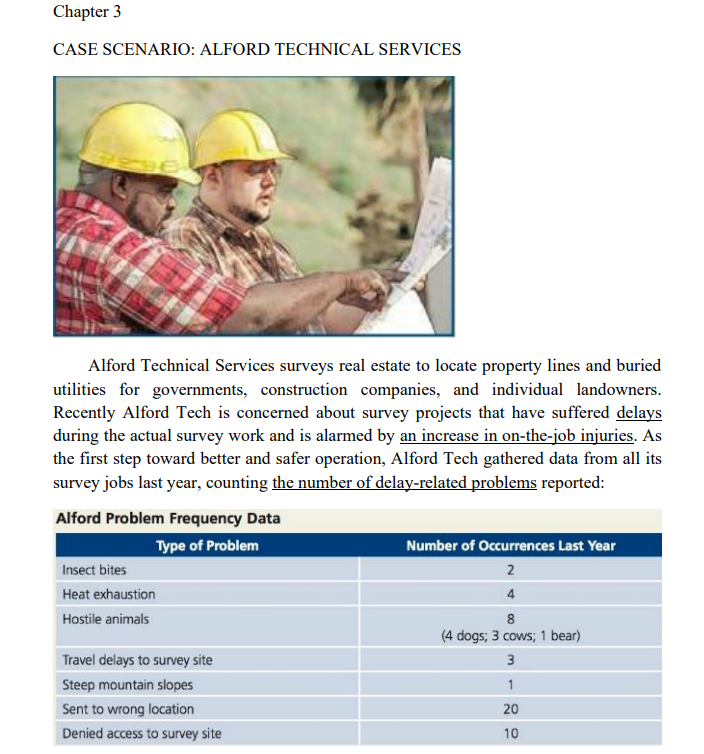
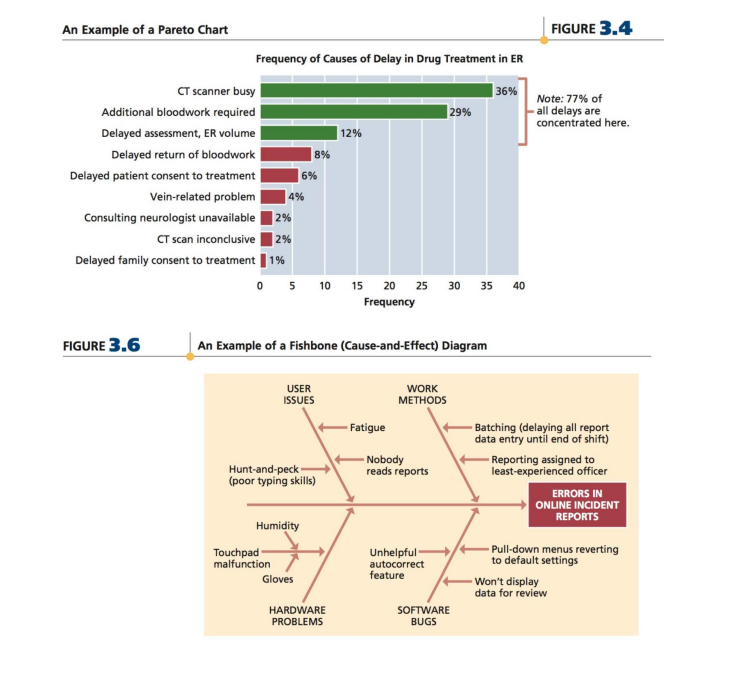
CASE SCENARIO: ALFORD TECHNICAL SERVICES Alford Technical Services surveys real estate to locate property lines and buried utilities for governments, construction companies, and individual landowners. Recently Alford Tech is concerned about survey projects that have suffered delays during the actual survey work and is alarmed by an increase in on-the-job injuries. As the first step toward better and safer operation, Alford Tech gathered data from all its survey jobs last year, counting the number of delay-related problems reported: Alford Tech recognizes that all these problems can be organized into four major categories: City Factors, Rural Factors, Client's Mistake, and Dispatcher's Mistake. Half of all cases of heat exhaustion, as well as all hostile dogs and all travel delays to the site, occurred in the city. Insects, cows, and bears were all associated with rural jobs, as were steep mountain slopes. Alford Tech determined that half of all instances of Sent to Wrong Location, as well as all the instances in which the survey crew was denied access to the survey site upon arrival, were the Client's Mistake. Questions 1. Over half of all problems last year are accounted for by which two types of problem? 2. Organize the frequency data from the table into a Pareto chart similar to Figure 3.4. 3. Now consider Alford Tech's four major categories of delay-causing problems. Create a fishbone diagram similar to Figure 3.6 , displaying both the problems and the categories in a relevant arrangement. 4. Which of the four major categories is the most significant in terms of the number of problems last year? Are City Factors or Rural Factors more problematic for Alford Technical Services? An Example of a Pareto Chart FIGURE 3. 4 Frequency of Causes of Delay in Drug Treatment in ER FIGURE 3.6 An Example of a Fishbone (Cause-and-Effect) Diagram
Step by Step Solution
There are 3 Steps involved in it
Step: 1
Get Instant Access to Expert-Tailored Solutions
See step-by-step solutions with expert insights and AI powered tools for academic success
Step: 2
Step: 3
Ace Your Homework with AI
Get the answers you need in no time with our AI-driven, step-by-step assistance
Get Started