

Answered step by step
Verified Expert Solution
Question
1 Approved Answer
CASE STUDY 4.1 When One of the BRIC(K)s Falls: Trials and Tribulations of the Indian Rupee This case study accompanies Chapter 4 of International Corporate
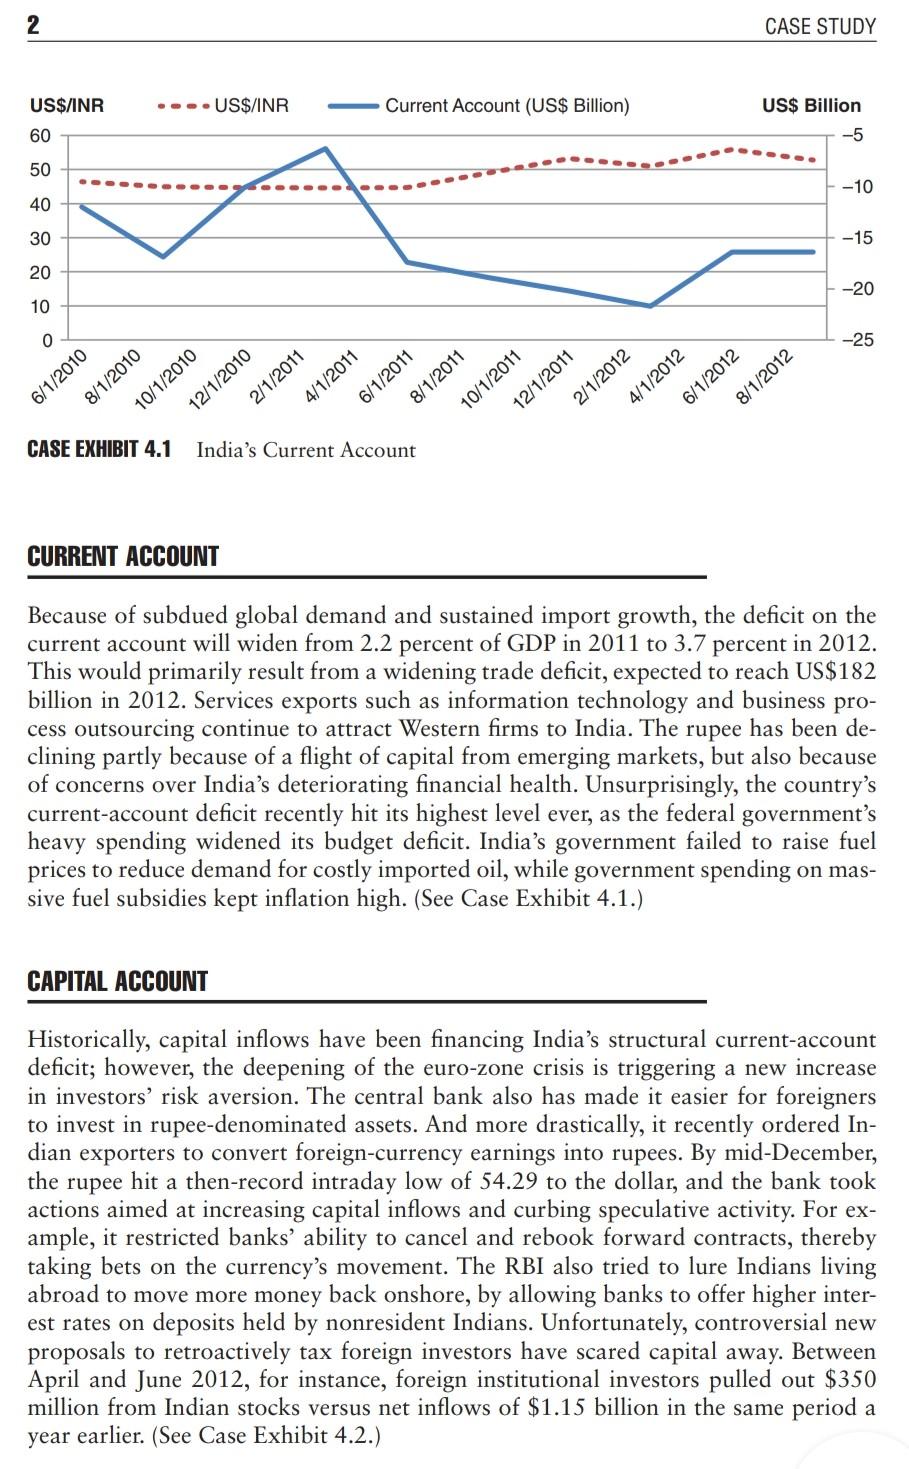
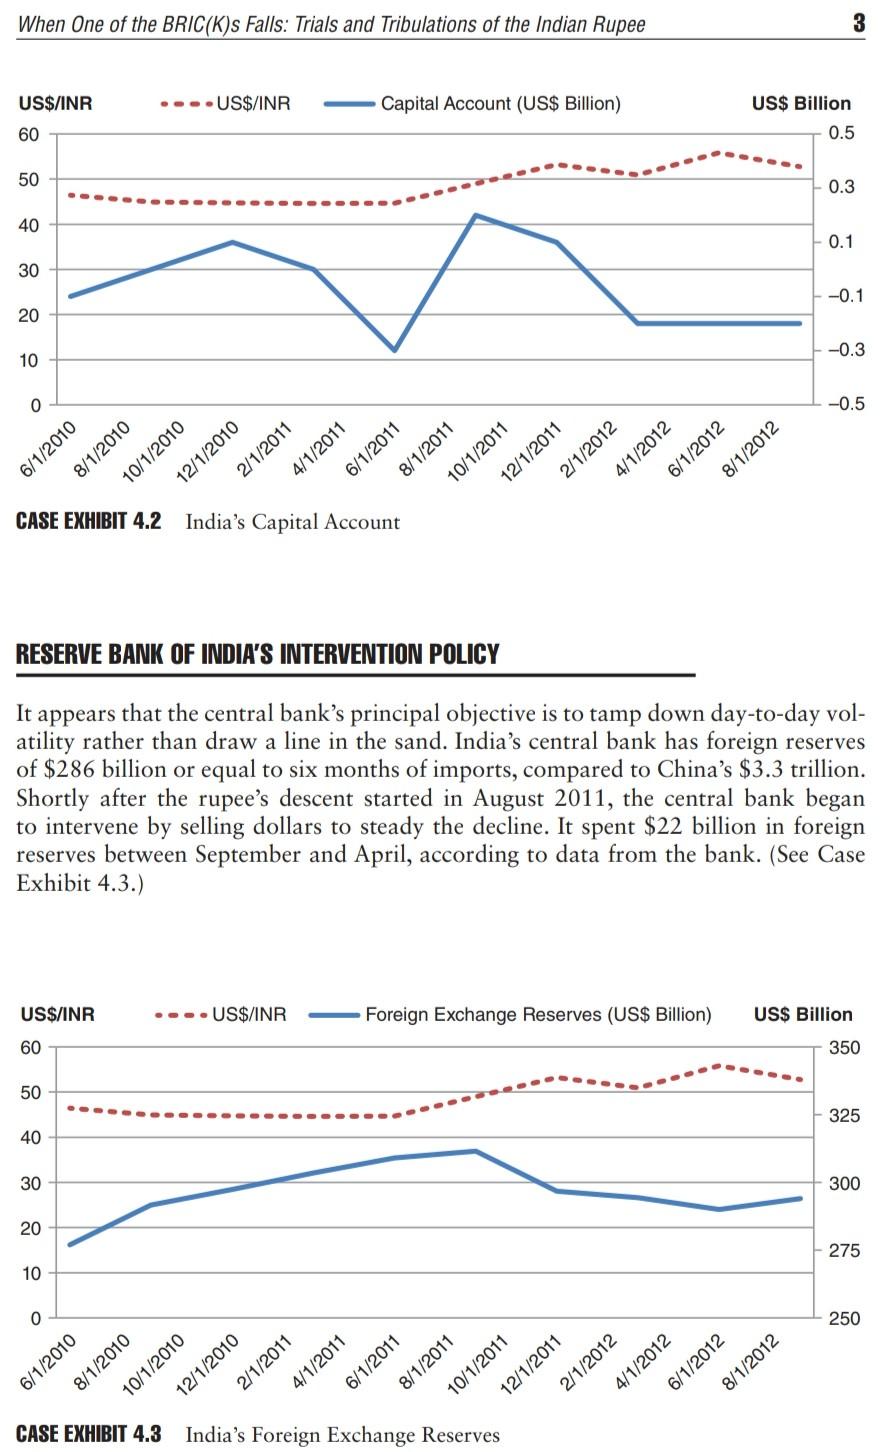
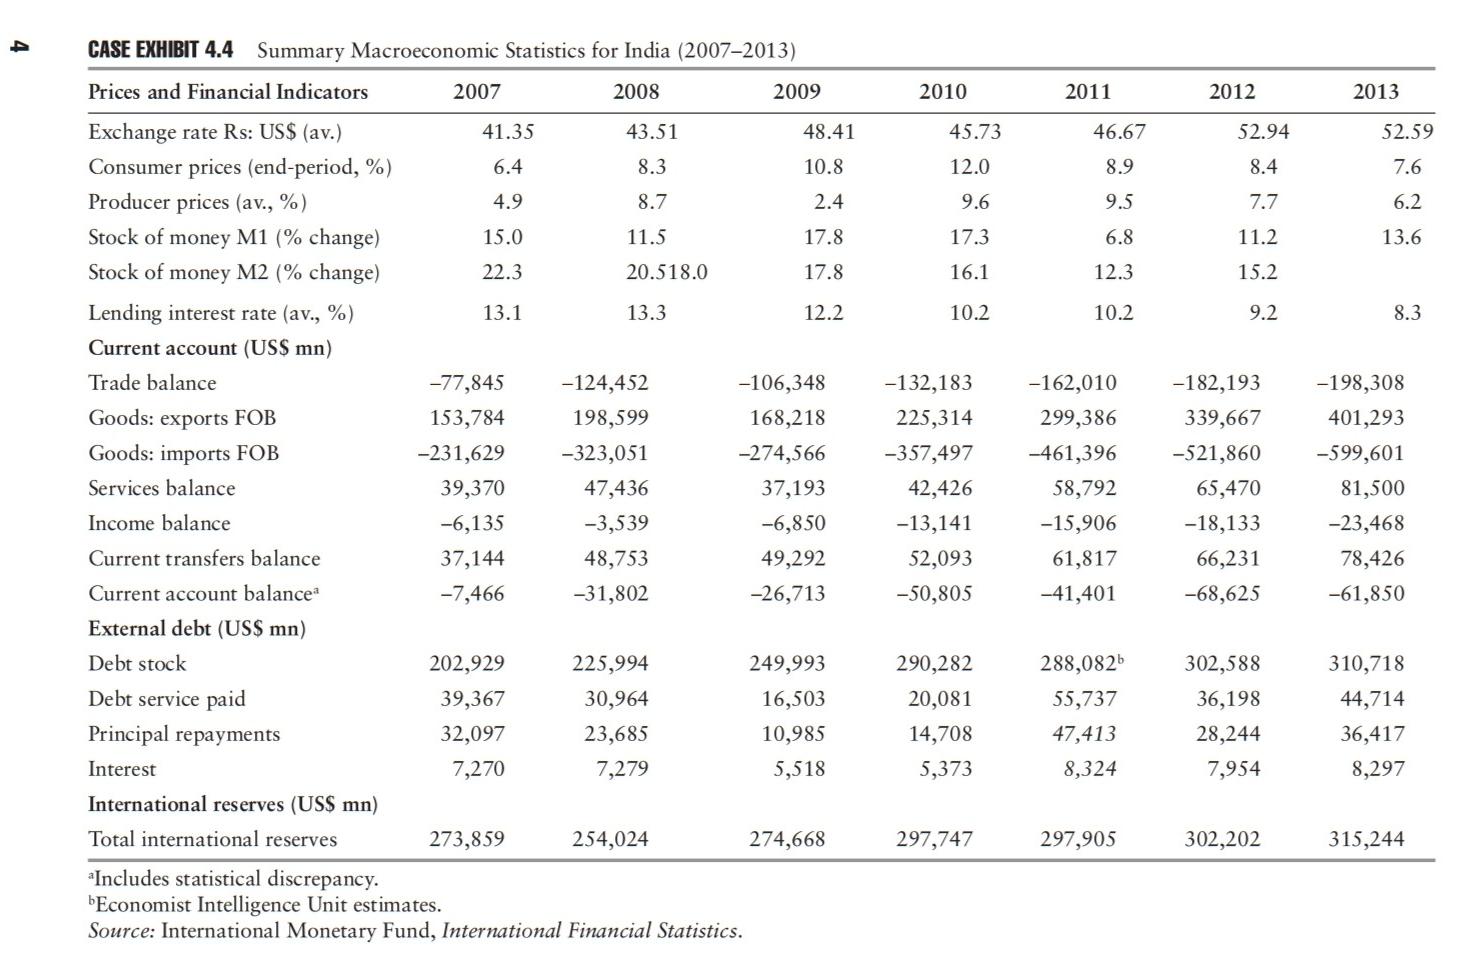
CASE STUDY 4.1 When One of the BRIC(K)s Falls: Trials and Tribulations of the Indian Rupee This case study accompanies Chapter 4 of International Corporate Finance. The chapter on the Fall of the Rupee you may omit. It is somewhat too sensational. Miss Prism, in Oscar Wildes The Importance of Being Earnest, 1895 Narendra Aneja is the chief investment strategist at the Flying Dragon Fund-an India country fund domiciled in Bostonthat has close to $1 billion under man- agement in Indian stocks. The first semester of 2012 had been an utter disaster, with the Bombay Stock Exchange down more than 18 percent, further compounded by a steep depreciation of the rupee. Narendra was reviewing the latest balance of payments statistics and short-term projections (see the case exhibits) in prepara- tion for the board quarterly meeting, when he would have to map out the rupee's likely course. Somehow he would have to make amends for failing to anticipate the reversal in the rupee's fortunes, which only a year ago had seemed so much more auspicious. ECONOMIC GROWTH AND FISCAL DEFICITS In spite of its economy expanding at the rate of 6 percent in the first two quarters of 2012, India's currency was now down 20 percent on the year, while its budget deficit at 5.9 percent of GDP (March 2011 to March 2012) grossly overshot its tar- get of 4.6 percent. Structural economic reforms are hindered by the government's lack of a reliable parliamentary majority, and it is likely to focus on the more pressing concerns of high inflation, slower economic growth, and a falling rupee. For almost a year, India's central bankthe Reserve Bank of India (RBI)has spent billions of dollars to support the beleaguered rupee but still seems powerless in bucking the downward trend. Some analysts see the exchange rate weakening further toward 60 rupees per U.S. dollar by year-end, versus its closing rate of 54.48 rupees. 2 CASE STUDY US$/INR .-= US$/INR Current Account (US$ Billion) US$ Billion 60 -5 50 -10 40 30 -15 20 -20 10 0 -25 4/1/2011 6/1/2010 8/1/2010 10/1/2010 12/1/2010 2/1/2011 6/1/2011 8/1/2011 10/1/2011 12/1/2011 2/1/2012 4/1/2012 6/1/2012 8/1/2012 CASE EXHIBIT 4.1 India's Current Account CURRENT ACCOUNT Because of subdued global demand and sustained import growth, the deficit on the current account will widen from 2.2 percent of GDP in 2011 to 3.7 percent in 2012. This would primarily result from a widening trade deficit, expected to reach US$182 billion in 2012. Services exports such as information technology and business pro- cess outsourcing continue to attract Western firms to India. The rupee has been de- clining partly because of a flight of capital from emerging markets, but also because of concerns over India's deteriorating financial health. Unsurprisingly, the country's current-account deficit recently hit its highest level ever, as the federal government's heavy spending widened its budget deficit. India's government failed to raise fuel prices to reduce demand for costly imported oil, while government spending on mas- sive fuel subsidies kept inflation high. (See Case Exhibit 4.1.) CAPITAL ACCOUNT Historically, capital inflows have been financing India's structural current-account deficit; however, the deepening of the euro-zone crisis is triggering a new increase in investors' risk aversion. The central bank also has made it easier for foreigners to invest in rupee-denominated assets. And more drastically, it recently ordered In- dian exporters to convert foreign-currency earnings into rupees. By mid-December, the rupee hit a then-record intraday low of 54.29 to the dollar, and the bank took actions aimed at increasing capital inflows and curbing speculative activity. For ex- ample, it restricted banks' ability to cancel and rebook forward contracts, thereby taking bets on the currency's movement. The RBI also tried to lure Indians living abroad to move more money back onshore, by allowing banks to offer higher inter- est rates on deposits held by nonresident Indians. Unfortunately, controversial new proposals to retroactively tax foreign investors have scared capital away. Between April and June 2012, for instance, foreign institutional investors pulled out $350 million from Indian stocks versus net inflows of $1.15 billion in the same period a year earlier. (See Case Exhibit 4.2.) When one of the BRIC(K)s Falls: Trials and Tribulations of the Indian Rupee 3 US$/INR ...US$/INR Capital Account (US$ Billion) US$ Billion 0.5 60 50 0.3 40 0.1 30 -0.1 20 -0.3 10 0 -0.5 6/1/2010 8/1/2010 10/1/2010 10/1/2011 CLOT/LIC| 12/1/2010 2/1/2011 4/1/2011 6/1/2011 8/1/2011 12/1/2011 4/1/2012 6/1/2012 8/1/2012 CASE EXHIBIT 4.2 India's Capital Account RESERVE BANK OF INDIA'S INTERVENTION POLICY It appears that the central banks principal objective is to tamp down day-to-day vol- atility rather than draw a line in the sand. Indias central bank has foreign reserves of $286 billion or equal to six months of imports, compared to China's $3.3 trillion. Shortly after the rupee's descent started in August 2011, the central bank began to intervene by selling dollars to steady the decline. It spent $22 billion in foreign reserves between September and April, according to data from the bank. (See Case Exhibit 4.3.) US$/INR ....US$/INR Foreign Exchange Reserves (US$ Billion) US$ Billion 60 350 50 325 40 30 300 20 275 10 0 250 6/1/2010 8/1/2010 OLORE 4/1/2011 8/1/2011 10/1/2011 12/1/2011 2/1/2012 4/1/2012 6/1/2012 8/1/2012 10/1/2010 2/1/2011 6/1/2011 CASE EXHIBIT 4.3 India's Foreign Exchange Reserves CASE EXHIBIT 4.4 Summary Macroeconomic Statistics for India (2007-2013) Prices and Financial Indicators 2007 2008 2009 2010 2011 2012 2013 45.73 46.67 52.94 52.59 12.0 8.9 8.4 7.6 9.6 9.5 7.7 6.2 17.3 6.8 11.2 13.6 16.1 12.3 15.2 10.2 10.2 9.2 8.3 Exchange rate Rs: US$ (av.) 41.35 43.51 48.41 Consumer prices (end-period, %) 6.4 8.3 10.8 Producer prices (av., %) 4.9 8.7 2.4 Stock of money M1 (% change) 15.0 11.5 17.8 Stock of money M2 (% change) 22.3 20.518.0 17.8 Lending interest rate (av., %) 13.1 13.3 12.2 Current account (US$ mn) Trade balance -77,845 -124,452 -106,348 Goods: exports FOB 153,784 198,599 168,218 Goods: imports FOB -231,629 -323,051 -274,566 Services balance 39,370 47,436 37,193 Income balance -6,135 -3,539 -6,850 Current transfers balance 37,144 48,753 49,292 Current account balancea -7,466 -31,802 -26,713 External debt (US$ mn) Debt stock 202,929 225,994 249,993 Debt service paid 39,367 30,964 16,503 Principal repayments 32,097 23,685 10,985 Interest 7,270 7,279 5,518 International reserves (US$ mn) Total international reserves 273,859 254,024 274,668 Includes statistical discrepancy. "Economist Intelligence Unit estimates. Source: International Monetary Fund, International Financial Statistics. -132,183 225,314 -357,497 42,426 -13,141 52,093 -50,805 -162,010 299,386 -461,396 58,792 -15,906 61,817 -41,401 -182,193 339,667 -521,860 65,470 -18,133 66,231 -68,625 -198,308 401,293 -599,601 81,500 -23,468 78,426 -61,850 310,718 44,714 290,282 20,081 14,708 5,373 288,0826 55,737 47,413 8,324 302,588 36,198 28,244 7,954 36,417 8,297 297,747 297,905 302,202 315,244 When one of the BRIC(K)s Falls: Trials and Tribulations of the Indian Rupee 5 QUESTIONS FOR DISCUSSION Refer to Case Exhibit 4.4 to answer questions 1 through 5. 1. Analyze India's current account performance over the period 2007 to 2012. 2. What is the relationship between India's fiscal policies and its current account? 3. Does it explain the recent steep rupee's depreciation? 4. How would you characterize RBI's forex policy? 5. What is the outlook for the rupee over the next 6 to 18 months? CASE STUDY 4.1 When One of the BRIC(K)s Falls: Trials and Tribulations of the Indian Rupee This case study accompanies Chapter 4 of International Corporate Finance. The chapter on the Fall of the Rupee you may omit. It is somewhat too sensational. Miss Prism, in Oscar Wildes The Importance of Being Earnest, 1895 Narendra Aneja is the chief investment strategist at the Flying Dragon Fund-an India country fund domiciled in Bostonthat has close to $1 billion under man- agement in Indian stocks. The first semester of 2012 had been an utter disaster, with the Bombay Stock Exchange down more than 18 percent, further compounded by a steep depreciation of the rupee. Narendra was reviewing the latest balance of payments statistics and short-term projections (see the case exhibits) in prepara- tion for the board quarterly meeting, when he would have to map out the rupee's likely course. Somehow he would have to make amends for failing to anticipate the reversal in the rupee's fortunes, which only a year ago had seemed so much more auspicious. ECONOMIC GROWTH AND FISCAL DEFICITS In spite of its economy expanding at the rate of 6 percent in the first two quarters of 2012, India's currency was now down 20 percent on the year, while its budget deficit at 5.9 percent of GDP (March 2011 to March 2012) grossly overshot its tar- get of 4.6 percent. Structural economic reforms are hindered by the government's lack of a reliable parliamentary majority, and it is likely to focus on the more pressing concerns of high inflation, slower economic growth, and a falling rupee. For almost a year, India's central bankthe Reserve Bank of India (RBI)has spent billions of dollars to support the beleaguered rupee but still seems powerless in bucking the downward trend. Some analysts see the exchange rate weakening further toward 60 rupees per U.S. dollar by year-end, versus its closing rate of 54.48 rupees. 2 CASE STUDY US$/INR .-= US$/INR Current Account (US$ Billion) US$ Billion 60 -5 50 -10 40 30 -15 20 -20 10 0 -25 4/1/2011 6/1/2010 8/1/2010 10/1/2010 12/1/2010 2/1/2011 6/1/2011 8/1/2011 10/1/2011 12/1/2011 2/1/2012 4/1/2012 6/1/2012 8/1/2012 CASE EXHIBIT 4.1 India's Current Account CURRENT ACCOUNT Because of subdued global demand and sustained import growth, the deficit on the current account will widen from 2.2 percent of GDP in 2011 to 3.7 percent in 2012. This would primarily result from a widening trade deficit, expected to reach US$182 billion in 2012. Services exports such as information technology and business pro- cess outsourcing continue to attract Western firms to India. The rupee has been de- clining partly because of a flight of capital from emerging markets, but also because of concerns over India's deteriorating financial health. Unsurprisingly, the country's current-account deficit recently hit its highest level ever, as the federal government's heavy spending widened its budget deficit. India's government failed to raise fuel prices to reduce demand for costly imported oil, while government spending on mas- sive fuel subsidies kept inflation high. (See Case Exhibit 4.1.) CAPITAL ACCOUNT Historically, capital inflows have been financing India's structural current-account deficit; however, the deepening of the euro-zone crisis is triggering a new increase in investors' risk aversion. The central bank also has made it easier for foreigners to invest in rupee-denominated assets. And more drastically, it recently ordered In- dian exporters to convert foreign-currency earnings into rupees. By mid-December, the rupee hit a then-record intraday low of 54.29 to the dollar, and the bank took actions aimed at increasing capital inflows and curbing speculative activity. For ex- ample, it restricted banks' ability to cancel and rebook forward contracts, thereby taking bets on the currency's movement. The RBI also tried to lure Indians living abroad to move more money back onshore, by allowing banks to offer higher inter- est rates on deposits held by nonresident Indians. Unfortunately, controversial new proposals to retroactively tax foreign investors have scared capital away. Between April and June 2012, for instance, foreign institutional investors pulled out $350 million from Indian stocks versus net inflows of $1.15 billion in the same period a year earlier. (See Case Exhibit 4.2.) When one of the BRIC(K)s Falls: Trials and Tribulations of the Indian Rupee 3 US$/INR ...US$/INR Capital Account (US$ Billion) US$ Billion 0.5 60 50 0.3 40 0.1 30 -0.1 20 -0.3 10 0 -0.5 6/1/2010 8/1/2010 10/1/2010 10/1/2011 CLOT/LIC| 12/1/2010 2/1/2011 4/1/2011 6/1/2011 8/1/2011 12/1/2011 4/1/2012 6/1/2012 8/1/2012 CASE EXHIBIT 4.2 India's Capital Account RESERVE BANK OF INDIA'S INTERVENTION POLICY It appears that the central banks principal objective is to tamp down day-to-day vol- atility rather than draw a line in the sand. Indias central bank has foreign reserves of $286 billion or equal to six months of imports, compared to China's $3.3 trillion. Shortly after the rupee's descent started in August 2011, the central bank began to intervene by selling dollars to steady the decline. It spent $22 billion in foreign reserves between September and April, according to data from the bank. (See Case Exhibit 4.3.) US$/INR ....US$/INR Foreign Exchange Reserves (US$ Billion) US$ Billion 60 350 50 325 40 30 300 20 275 10 0 250 6/1/2010 8/1/2010 OLORE 4/1/2011 8/1/2011 10/1/2011 12/1/2011 2/1/2012 4/1/2012 6/1/2012 8/1/2012 10/1/2010 2/1/2011 6/1/2011 CASE EXHIBIT 4.3 India's Foreign Exchange Reserves CASE EXHIBIT 4.4 Summary Macroeconomic Statistics for India (2007-2013) Prices and Financial Indicators 2007 2008 2009 2010 2011 2012 2013 45.73 46.67 52.94 52.59 12.0 8.9 8.4 7.6 9.6 9.5 7.7 6.2 17.3 6.8 11.2 13.6 16.1 12.3 15.2 10.2 10.2 9.2 8.3 Exchange rate Rs: US$ (av.) 41.35 43.51 48.41 Consumer prices (end-period, %) 6.4 8.3 10.8 Producer prices (av., %) 4.9 8.7 2.4 Stock of money M1 (% change) 15.0 11.5 17.8 Stock of money M2 (% change) 22.3 20.518.0 17.8 Lending interest rate (av., %) 13.1 13.3 12.2 Current account (US$ mn) Trade balance -77,845 -124,452 -106,348 Goods: exports FOB 153,784 198,599 168,218 Goods: imports FOB -231,629 -323,051 -274,566 Services balance 39,370 47,436 37,193 Income balance -6,135 -3,539 -6,850 Current transfers balance 37,144 48,753 49,292 Current account balancea -7,466 -31,802 -26,713 External debt (US$ mn) Debt stock 202,929 225,994 249,993 Debt service paid 39,367 30,964 16,503 Principal repayments 32,097 23,685 10,985 Interest 7,270 7,279 5,518 International reserves (US$ mn) Total international reserves 273,859 254,024 274,668 Includes statistical discrepancy. "Economist Intelligence Unit estimates. Source: International Monetary Fund, International Financial Statistics. -132,183 225,314 -357,497 42,426 -13,141 52,093 -50,805 -162,010 299,386 -461,396 58,792 -15,906 61,817 -41,401 -182,193 339,667 -521,860 65,470 -18,133 66,231 -68,625 -198,308 401,293 -599,601 81,500 -23,468 78,426 -61,850 310,718 44,714 290,282 20,081 14,708 5,373 288,0826 55,737 47,413 8,324 302,588 36,198 28,244 7,954 36,417 8,297 297,747 297,905 302,202 315,244 When one of the BRIC(K)s Falls: Trials and Tribulations of the Indian Rupee 5 QUESTIONS FOR DISCUSSION Refer to Case Exhibit 4.4 to answer questions 1 through 5. 1. Analyze India's current account performance over the period 2007 to 2012. 2. What is the relationship between India's fiscal policies and its current account? 3. Does it explain the recent steep rupee's depreciation? 4. How would you characterize RBI's forex policy? 5. What is the outlook for the rupee over the next 6 to 18 months
Step by Step Solution
There are 3 Steps involved in it
Step: 1

Get Instant Access to Expert-Tailored Solutions
See step-by-step solutions with expert insights and AI powered tools for academic success
Step: 2

Step: 3
Ace Your Homework with AI
Get the answers you need in no time with our AI-driven, step-by-step assistance
Get Started
Crypto Spotlight Series Polkadot
Authors: Nott U.r. Keys
1st Edition
979-8854241342