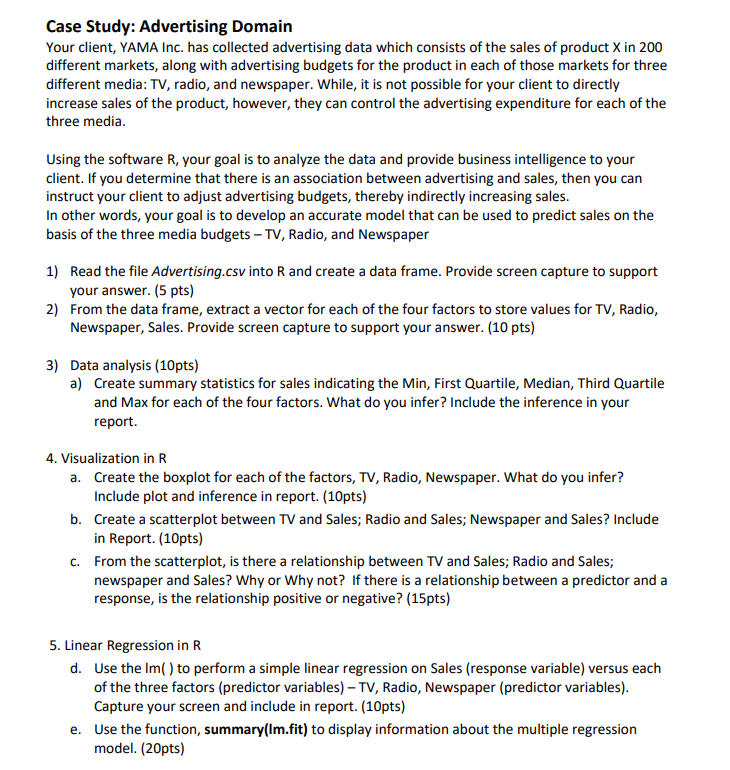
Case Study: Advertising Domain Your client, YAMA Inc. has collected advertising data which consists of the sales of product X in 200 different markets, along with advertising budgets for the product in each of those markets for three different media: TV, radio, and newspaper. While, it is not possible for your client to directly increase sales of the product, however, they can control the advertising expenditure for each of the three media. Using the software R, your goal is to analyze the data and provide business intelligence to your client. If you determine that there is an association between advertising and sales, then you can instruct your client to adjust advertising budgets, thereby indirectly increasing sales. In other words, your goal is to develop an accurate model that can be used to predict sales on the basis of the three media budgets - TV, Radio, and Newspaper 1) Read the file Advertising.csv into R and create a data frame. Provide screen capture to support your answer. (5 pts) 2) From the data frame, extract a vector for each of the four factors to store values for TV, Radio, Newspaper, Sales. Provide screen capture to support your answer. (10 pts) 3) Data analysis (10pts) a) Create summary statistics for sales indicating the Min, First Quartile, Median, Third Quartile and Max for each of the four factors. What do you infer? Include the inference in your report. 4. Visualization in R a. Create the boxplot for each of the factors, TV, Radio, Newspaper. What do you infer? Include plot and inference in report. (10pts) b. Create a scatterplot between TV and Sales; Radio and Sales; Newspaper and Sales? Include in Report. (10pts) c. From the scatterplot, is there a relationship between TV and Sales; Radio and Sales; newspaper and Sales? Why or Why not? If there is a relationship between a predictor and a response, is the relationship positive or negative? (15pts) 5. Linear Regression in R d. Use the Im( ) to perform a simple linear regression on Sales (response variable) versus each of the three factors (predictor variables) - TV, Radio, Newspaper (predictor variables). Capture your screen and include in report. (10pts) e. Use the function, summary(Im.fit) to display information about the multiple regression model. (20pts)


