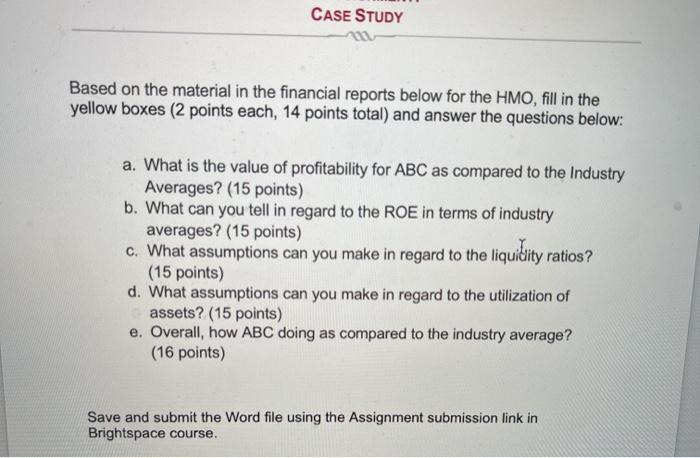
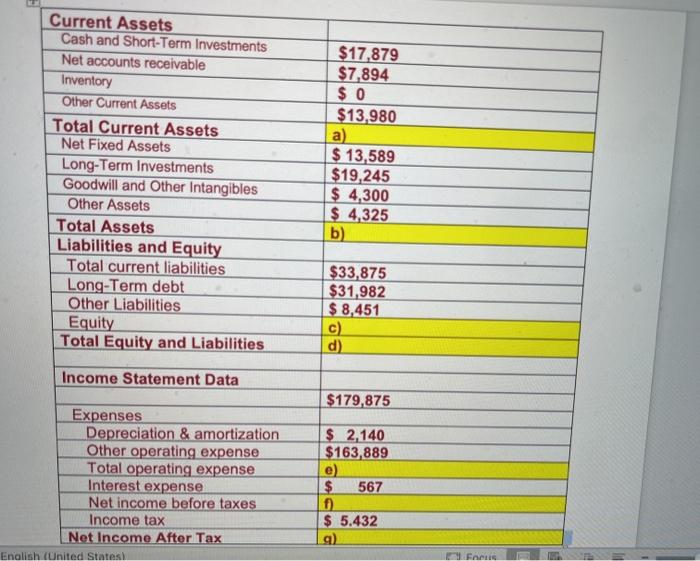
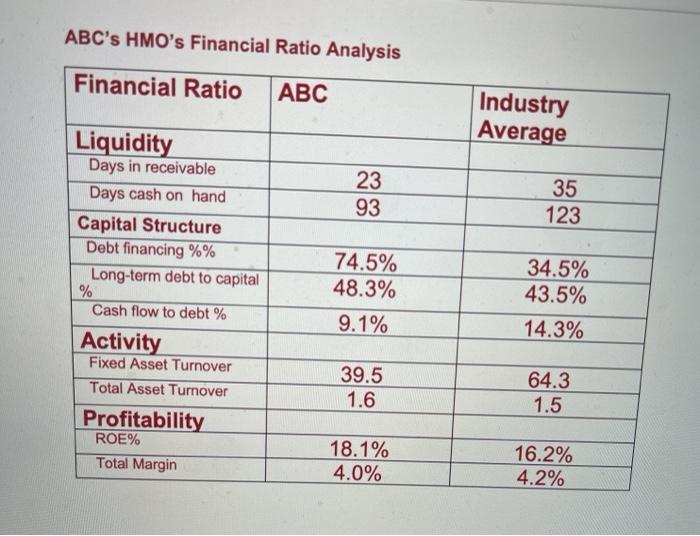
CASE STUDY Based on the material in the financial reports below for the HMO, fill in the yellow boxes (2 points each, 14 points total) and answer the questions below: a. What is the value of profitability for ABC as compared to the Industry Averages? (15 points) b. What can you tell in regard to the ROE in terms of industry averages? (15 points) c. What assumptions can you make in regard to the liquidity ratios? (15 points) d. What assumptions can you make in regard to the utilization of assets? (15 points) e. Overall, how ABC doing as compared to the industry average? (16 points) Save and submit the Word file using the Assignment submission link in Brightspace course. Current Assets Cash and Short-Term Investments Net accounts receivable Inventory Other Current Assets Total Current Assets Net Fixed Assets Long-Term Investments Goodwill and Other Intangibles Other Assets Total Assets Liabilities and Equity Total current liabilities Long-Term debt Other Liabilities Equity Total Equity and Liabilities $17,879 $7,894 $ 0 $13,980 a) $ 13,589 $19,245 $ 4,300 $ 4,325 b) $33,875 $31,982 $ 8,451 c) d) Income Statement Data $179,875 Expenses Depreciation & amortization Other operating expense Total operating expense Interest expense Net income before taxes Income tax Net Income After Tax English (United States $ 2,140 $163,889 e) $ 567 f $ 5.432 9) ABC's HMO's Financial Ratio Analysis Financial Ratio ABC Industry Average 23 93 Liquidity Days in receivable Days cash on hand Capital Structure Debt financing %% Long-term debt to capital % Cash flow to debt % 35 123 74.5% 48.3% 9.1% 34.5% 43.5% 14.3% Activity Fixed Asset Turnover Total Asset Turnover 39.5 1.6 64.3 1.5 Profitability ROE% Total Margin 18.1% 4.0% 16.2% 4.2%