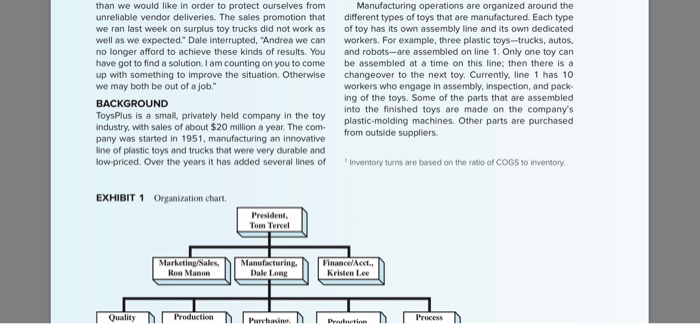
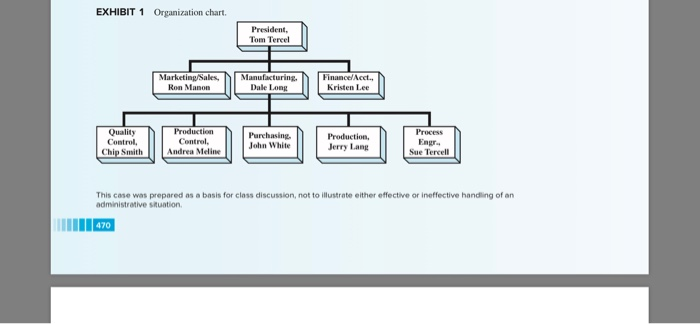
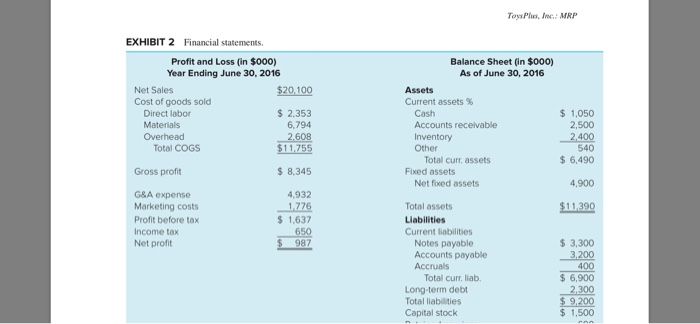
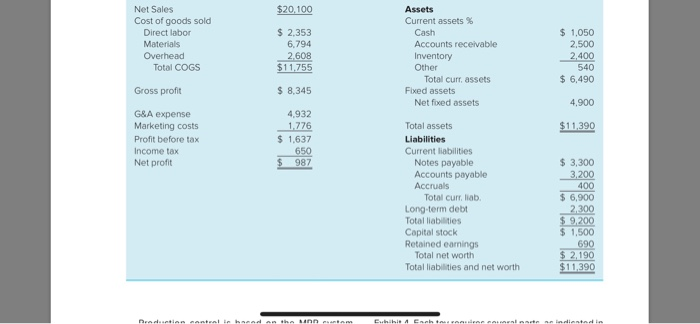
Case Study eXcel ToysPlus,Inc.: MRP Dale Long, vice president of manufacturing for ToysPlus, Inc., finished reading the weekly production report for the week ended September 16, 2016. Inventories were up once again, and service levels were lower than expected. Dale wondered why these problems could not be solved once and for all. Last year he had installed a new production and inventory control system on the company's server. While the system drastically reduced inventories and improved service levels at first, things had gotten worse over the last few months. Dale took the report and walked to Andrea Meline's office next door. Andrea had received her M.B.A. a few years ago from a prestigious business school and was now in charge of production control for the company. After exchanging the usual greetings, Dale asked Andrea why the latest figures were not better. Andrea responded, "Dale, we continue to get poor forecasts from marketing, and we have to carry more inventory than we would like in order to protect ourselves from unreliable vendor deliveries. The sales promotion that toys and is now making 22 different toys, including games, dolls, toy vehicles, and novelty items. The company has a typical functional organization, as shown in Exhibit 1 ToysPlus has had relatively poor financial results, as shown in Exhibit 2. Profits are averaging only 5 percent of sales, and return on assets is less than 10 percent. To improve the situation, the company has decided to make a major effort to reduce inventories and to improve cus- tomer service. In an effort to reduce costs, the company has begun to redesign the toys for manufacturability and automate its production process. The company feels that unit production costs could be reduced at least 5 percent per year by these efforts. The company also wants to achieve at least 15 inventory turns per year and a service level of 95 percent. Service level is defined as the percentage of orders filled within one week of customer order. The current service level is 90 percent Manufacturing operations are organized around the different types of toys that are manufactured. Each type than we would like in order to protect ourselves from unreliable vendor deliveries. The sales promotion that we ran last week on surplus toy trucks did not work as well as we expected." Dale interrupted, "Andrea we can no longer afford to achieve these kinds of results. You have got to find a solution. I am counting on you to come up with something to improve the situation. Otherwise we may both be out of a job. Manufacturing operations are organized around the different types of toys that are manufactured. Each type of toy has its own assembly line and its own dedicated workers. For example, three plastic toys-trucks, autos, and robots-are assembled on line 1. Only one toy can be assembled at a time on this line; then there is a changeover to the next toy. Currently, line 1 has 10 workers who engage in assembly, inspection, and pack ing of the toys. Some of the parts that are assembled into the finished toys are made on the company's plastic-molding machines. Other parts are purchased from outside suppliers BACKGROUND ToysPlus is a small, privately held company in the toy industry, with sales of about $20 million a year. The com- pany was started in 1951, manufacturing an innovative line of plastic toys and trucks that were very durable and low-priced. Over the years it has added several lines of Inventory turns are based on the ratio of COGS to inventory EXHIBIT 1 Organization chart. President Tom Tercel Marketing/Sales, Manufacturing, Finance/Acct Dale Long Kristen Lee Ron Manon Quality Process Production Purchasine. Praduction EXHIBIT 1 Organization chart. President Tom Tercel Manufacturing Dale Long Finance/Acct. Kristen Lee Marketing/Sales Ron Manon Production Quality Control Chip Smith Process Engr Sue Tercell Purchasing John White Production, Control, Andrea Meline Jerry Lang This case was prepared as a basis for class discussion, not to illustrate either effective or ineffective handling of an administrative situation 470 ToysPls, Inc.: MRP EXHIBIT 2 Financial statements Profit and Loss (in $000) Balance Sheet (in $000) Year Ending June 30, 2016 As of June 30, 2016 Net Sales $20,100 Assets Cost of goods sold Current assets % $ 2,353 $1,050 2,500 2,400 540 $ 6,490 Direct labor Cash Materials 6,794 Accounts receivable Inventory Other Overhead 2.608 Total COGS $11,755 Total curr, assets Gross profit $8,345 Fixed assets Net fixed assets 4,900 G&A expense Marketing costs Profit before tax 4,932 1,776 $1,637 Total assets $11,390 Liabilities Income tax Net profit 50 rrent liabilities 987 Notes payable Accounts payable Accruals $ 3,300 3.200 400 $ 6,900 Total curr, liab Long-term debt Total liabilities Capital stock 2,300 $ 9,200 $1,500 Net Sales Cost of goods sold $20,100 Assets Current assets % $ 2,353 1,050 2,500 2,400 Direct labor Cash 6,794 2,608 $11,755 Materials Accounts receivable Overhead Inventory Total COGS Other 540 Total curr, assets Fixed assets Net fixed assets 6,490 Gross profit 8,345 4,900 G&A expense 4,932 1,776 $11,390 Marketing costs Total assets Profit before tax Income tax Net profit 1,637 Liabilities 650 Current liabilities Notes payable Accounts payable Accruals $3,300 3,200 400 987 $ 6,900 2,300 $ 9,200 $1,500 690 $2,190 $11,390 Total curr. liab. Long-term debt Total liabilities Capital stock Retained earnings Total net worth Total liabilities and net worth adtinn santeal i haead an the nn etom Euhibi Ench t naene oenl ate indientad in Production control is based on the MRP system. Every week a master schedule is prepared for the next six weeks. This master schedule specifies for assembly line 1, for example, the number of trucks, autos, and robots that will be produced in each week, as shown in Exhibit 3. Forecasts of weekly demand are received each week from marketing. Using past experience, Andrea adjusts these forecasts to reflect more realistic estimates of demand. She also utilizes the lot sizes Exhibit 4. Each toy requires several parts, as indicated in the bill of materials. For example, each auto requires one body, four wheels, two side windows, and one wind- shield. These parts are assembled, the product is inspected, and the toy is packed, which requires a total of.1 labor hour per auto. With 10 people working on the assembly line, at present, there are 350 hours of pro- ductive time available per week (35 hours each times 10). If the entire week is used to make autos, a total of 3,500 autos can be produced (350/.1). It takes.2 hour to make a truck and.15 hour to make a robot, thereby making it possible to produce a maximum of 1,750 trucks or 2,333 robots, if the entire line is devoted to shown in the Exhibit 3 master schedule for each of the three toys. These lot sizes are based on past practice in the company. A run-out time philosophy is used to first schedule the toy that has the lowest ratio of inven- tory to weekly demand (the run-out time). As a result the master schedule is prepared and entered into the either of these products. Production, however, is sched- uled in lots, and the entire week is not necessarily devoted to only one toy In between products it takes all 10 people one hour to change the setup of the line. This changeover involves moving out the parts for the old toy, moving in the parts for the new toy, arranging the jigs and fixtures for assembly, and making trial runs to make sure that quality is right. The shop labor rate is $14 per hour for wages, including fringe benefits. It costs 25 percent to computer. However, this master schedule might be infeasible when not enough parts are available in inventory or insufficient lead time remains to order more parts. As a result, the master schedule is checked for feasibility and adjusted accordingly before a final master schedule is approved. The computer performs a parts explosion using the bill of materials and the on-hand inventories shown in 472 Part Seven Case Studies EXHIBIT 3 Master schedule prepared September 16, 2016 Week Beginning Sept. 26 Oct. 10 Sept. 19 Oct. 3 Oct. 17 Oct. 24 Auto 3,500 500 3,500 Truck 1,500 1,750 2,333 2,333 Robot Weekly Forecast of Demand Week Beginning Sept. 19 Sept. 26 Oct. 3 Oct. 10 Oct. 17 Oct. 24 1,100 500 1,150 450 650 1,300 350 1,500 300 Auto 1,200 1,400 300 625 Truck 400 Robot 700 650 625 600 Products Products Toy auto Toy truck Toy robot Bill of materials. EXHIBIT 4 TETE Weeks Number Lead Required Current Part Number Description Cost Each Time Inventory On Order per Unit $3.20 1,45 1019 Toy auto Car body 4,000 2,500 9,800 523 525 Wheels 4 30 2 529 531 Side windows 15 25 $6.50 1 4,300 2 2,620 Windshield 1021 Toy truck Cab Wheels dual 2.000 615 1.70 1,800 800 due 9/26 617 8 sets .25 2 9,900 IT 4 Bill of malerias Number Weeks Lead Required Current Part Number Description Cost Each Time Inventory On Order per Unit 1019 Toy auto Car body $3.20 4,000 2,500 523 1,45 3 525 Wheels 4 30 2 9.800 529 Side windows 2 .15 4,300 2,620 2,000 1,800 531 Windshield 25 2 1021 615 Toy truck $6.50 1.70 Cab 3 800 due 9/26 617 Wheels dual 8 sets 25 2 9,900 Wheels single 619 2 30 2 2,500 621 Trailer 2.20 4 4,600 1,200 due 10/3 $4.10 1.80 35 25 1023 Toy robot Body 1 1,500 730 732 734 2 1,600 Arms 3,500 Legs Head 2 4,020 2,150 736 1.10 ToysPhs, Inc.: MRP deliveries from our suppliers. Will they cooperate? Maybe we will have to react faster in laying off and hiring workers in order to keep capacity closer to demand. What do you think of this situation? Is there carry inventory for a year. For parts and components that are ordered, it costs $25 to place each order. When the line is changed over, not only is a setup cost incurred for the labor to change the line but also an order is also triggered for each of the parts that is used to make the final product. The total setup cost of a line changeover is a solution? John answered, therefore the total of these costs. Purchasing does not always buy the exact number of parts that are ordered by the production control depart ment. Adjustments are made to take advantage of price breaks from suppliers or to achieve full-truckload ship ments. As a result, some additional parts might be pur- chased in order to reduce purchasing costs. Also, suppliers do not always ship the component parts when promised. As a result, ToysPlus carries safety stock inventory to protect the master production schedule and to keep the assembly lines running, no matter what. About one week of safety stock is carried to protect for late supplier deliveries. Management has mandated that the assembly lines will not shut down. Dale Long has stated that the company will not lay off You must remember, Andrea, the world is filled with hustlers and liars. The salespeople lie to you about forecasts, so they can have more inventory, just in case they need it. We in purchasing lie to our suppli- ers about when we need the parts, so that we can be sure to get them when we really need them. You pad the production schedule a little bit, just to make sure you can meet the shipments. We all are trying to cover ourselves so that we don't run out of stock There isn't a solution to this problem, because we are dealing with human nature. I hate to say it, but maybe top management's expectations are a bit unrealistic that inventory should be reduced and service improved. How can they expect anyone to accomplish these goals in an environment like this? workers on a week-to-week basis. Thus, if demand should be less than capacity, for example, by 10 percent in a week, production will be scheduled to full capacity to keep the workers busy. If this condition should con- Discussion Questions ull Capacty to keep the workers busy. If this condition should con- tinue for several weeks, workers will be laid off too adjust capacity. In a similar way, workers will be put on over time to meet demand temporarily. But if demand exceeds normal capacity for several weeks, more work ers will then be added. Discussion Questions 1. Calculate economic order quantities for each of the three types of toys. The EOQ formula is recommend ed from the supplement to Chapter 14 that considers uniform lot delivery of the toys. 2. Prepare a master production schedule for the next six weeks using the EOQS calculated in question 1 and a workforce of 10 employees. What inventory turnover ratio is achieved by this master schedule? How does this turnover compare with past levels and with management's goals? 3. Prepare a parts explosion to support the master schedule. What parts should be ordered each week? Are there enough planned orders in time to support A six-week rolling production schedule, based on existing capacity and lead times, is used. Each week one more week is added to keep the total master sched ule horizon at six weeks. Production is adjusted each week in line with available parts, capacity, and observed demand for toys HAPPY HOUR Andrea walked to General Joe's, a favorite watering hole, for happy hour with her friend from purchasing. John White. Andrea began, your master schedule? 4 What should Andrea Meline do to meet the inventory and service goals stated by management? Hint: I the turnover is too low from your first analysis and is not feasible using available parts, try another master schedule that is feasible with reduced production lev els, uses the available parts and has a turnover of 15 5. How should Andrea deal with the organization is- sues presented in this case? John, I don't know what I am going to do. Dale Long has laid the law down that I must reduce inventory and improve service levels. There is no alternative or excuses this time, I must do it! I'm not sure where to start. I would like better sales forecasts, but is that realistic to expect? Can I depend on marketing? I also could reduce inventory by achieving more reliable Case Study eXcel ToysPlus,Inc.: MRP Dale Long, vice president of manufacturing for ToysPlus, Inc., finished reading the weekly production report for the week ended September 16, 2016. Inventories were up once again, and service levels were lower than expected. Dale wondered why these problems could not be solved once and for all. Last year he had installed a new production and inventory control system on the company's server. While the system drastically reduced inventories and improved service levels at first, things had gotten worse over the last few months. Dale took the report and walked to Andrea Meline's office next door. Andrea had received her M.B.A. a few years ago from a prestigious business school and was now in charge of production control for the company. After exchanging the usual greetings, Dale asked Andrea why the latest figures were not better. Andrea responded, "Dale, we continue to get poor forecasts from marketing, and we have to carry more inventory than we would like in order to protect ourselves from unreliable vendor deliveries. The sales promotion that toys and is now making 22 different toys, including games, dolls, toy vehicles, and novelty items. The company has a typical functional organization, as shown in Exhibit 1 ToysPlus has had relatively poor financial results, as shown in Exhibit 2. Profits are averaging only 5 percent of sales, and return on assets is less than 10 percent. To improve the situation, the company has decided to make a major effort to reduce inventories and to improve cus- tomer service. In an effort to reduce costs, the company has begun to redesign the toys for manufacturability and automate its production process. The company feels that unit production costs could be reduced at least 5 percent per year by these efforts. The company also wants to achieve at least 15 inventory turns per year and a service level of 95 percent. Service level is defined as the percentage of orders filled within one week of customer order. The current service level is 90 percent Manufacturing operations are organized around the different types of toys that are manufactured. Each type than we would like in order to protect ourselves from unreliable vendor deliveries. The sales promotion that we ran last week on surplus toy trucks did not work as well as we expected." Dale interrupted, "Andrea we can no longer afford to achieve these kinds of results. You have got to find a solution. I am counting on you to come up with something to improve the situation. Otherwise we may both be out of a job. Manufacturing operations are organized around the different types of toys that are manufactured. Each type of toy has its own assembly line and its own dedicated workers. For example, three plastic toys-trucks, autos, and robots-are assembled on line 1. Only one toy can be assembled at a time on this line; then there is a changeover to the next toy. Currently, line 1 has 10 workers who engage in assembly, inspection, and pack ing of the toys. Some of the parts that are assembled into the finished toys are made on the company's plastic-molding machines. Other parts are purchased from outside suppliers BACKGROUND ToysPlus is a small, privately held company in the toy industry, with sales of about $20 million a year. The com- pany was started in 1951, manufacturing an innovative line of plastic toys and trucks that were very durable and low-priced. Over the years it has added several lines of Inventory turns are based on the ratio of COGS to inventory EXHIBIT 1 Organization chart. President Tom Tercel Marketing/Sales, Manufacturing, Finance/Acct Dale Long Kristen Lee Ron Manon Quality Process Production Purchasine. Praduction EXHIBIT 1 Organization chart. President Tom Tercel Manufacturing Dale Long Finance/Acct. Kristen Lee Marketing/Sales Ron Manon Production Quality Control Chip Smith Process Engr Sue Tercell Purchasing John White Production, Control, Andrea Meline Jerry Lang This case was prepared as a basis for class discussion, not to illustrate either effective or ineffective handling of an administrative situation 470 ToysPls, Inc.: MRP EXHIBIT 2 Financial statements Profit and Loss (in $000) Balance Sheet (in $000) Year Ending June 30, 2016 As of June 30, 2016 Net Sales $20,100 Assets Cost of goods sold Current assets % $ 2,353 $1,050 2,500 2,400 540 $ 6,490 Direct labor Cash Materials 6,794 Accounts receivable Inventory Other Overhead 2.608 Total COGS $11,755 Total curr, assets Gross profit $8,345 Fixed assets Net fixed assets 4,900 G&A expense Marketing costs Profit before tax 4,932 1,776 $1,637 Total assets $11,390 Liabilities Income tax Net profit 50 rrent liabilities 987 Notes payable Accounts payable Accruals $ 3,300 3.200 400 $ 6,900 Total curr, liab Long-term debt Total liabilities Capital stock 2,300 $ 9,200 $1,500 Net Sales Cost of goods sold $20,100 Assets Current assets % $ 2,353 1,050 2,500 2,400 Direct labor Cash 6,794 2,608 $11,755 Materials Accounts receivable Overhead Inventory Total COGS Other 540 Total curr, assets Fixed assets Net fixed assets 6,490 Gross profit 8,345 4,900 G&A expense 4,932 1,776 $11,390 Marketing costs Total assets Profit before tax Income tax Net profit 1,637 Liabilities 650 Current liabilities Notes payable Accounts payable Accruals $3,300 3,200 400 987 $ 6,900 2,300 $ 9,200 $1,500 690 $2,190 $11,390 Total curr. liab. Long-term debt Total liabilities Capital stock Retained earnings Total net worth Total liabilities and net worth adtinn santeal i haead an the nn etom Euhibi Ench t naene oenl ate indientad in Production control is based on the MRP system. Every week a master schedule is prepared for the next six weeks. This master schedule specifies for assembly line 1, for example, the number of trucks, autos, and robots that will be produced in each week, as shown in Exhibit 3. Forecasts of weekly demand are received each week from marketing. Using past experience, Andrea adjusts these forecasts to reflect more realistic estimates of demand. She also utilizes the lot sizes Exhibit 4. Each toy requires several parts, as indicated in the bill of materials. For example, each auto requires one body, four wheels, two side windows, and one wind- shield. These parts are assembled, the product is inspected, and the toy is packed, which requires a total of.1 labor hour per auto. With 10 people working on the assembly line, at present, there are 350 hours of pro- ductive time available per week (35 hours each times 10). If the entire week is used to make autos, a total of 3,500 autos can be produced (350/.1). It takes.2 hour to make a truck and.15 hour to make a robot, thereby making it possible to produce a maximum of 1,750 trucks or 2,333 robots, if the entire line is devoted to shown in the Exhibit 3 master schedule for each of the three toys. These lot sizes are based on past practice in the company. A run-out time philosophy is used to first schedule the toy that has the lowest ratio of inven- tory to weekly demand (the run-out time). As a result the master schedule is prepared and entered into the either of these products. Production, however, is sched- uled in lots, and the entire week is not necessarily devoted to only one toy In between products it takes all 10 people one hour to change the setup of the line. This changeover involves moving out the parts for the old toy, moving in the parts for the new toy, arranging the jigs and fixtures for assembly, and making trial runs to make sure that quality is right. The shop labor rate is $14 per hour for wages, including fringe benefits. It costs 25 percent to computer. However, this master schedule might be infeasible when not enough parts are available in inventory or insufficient lead time remains to order more parts. As a result, the master schedule is checked for feasibility and adjusted accordingly before a final master schedule is approved. The computer performs a parts explosion using the bill of materials and the on-hand inventories shown in 472 Part Seven Case Studies EXHIBIT 3 Master schedule prepared September 16, 2016 Week Beginning Sept. 26 Oct. 10 Sept. 19 Oct. 3 Oct. 17 Oct. 24 Auto 3,500 500 3,500 Truck 1,500 1,750 2,333 2,333 Robot Weekly Forecast of Demand Week Beginning Sept. 19 Sept. 26 Oct. 3 Oct. 10 Oct. 17 Oct. 24 1,100 500 1,150 450 650 1,300 350 1,500 300 Auto 1,200 1,400 300 625 Truck 400 Robot 700 650 625 600 Products Products Toy auto Toy truck Toy robot Bill of materials. EXHIBIT 4 TETE Weeks Number Lead Required Current Part Number Description Cost Each Time Inventory On Order per Unit $3.20 1,45 1019 Toy auto Car body 4,000 2,500 9,800 523 525 Wheels 4 30 2 529 531 Side windows 15 25 $6.50 1 4,300 2 2,620 Windshield 1021 Toy truck Cab Wheels dual 2.000 615 1.70 1,800 800 due 9/26 617 8 sets .25 2 9,900 IT 4 Bill of malerias Number Weeks Lead Required Current Part Number Description Cost Each Time Inventory On Order per Unit 1019 Toy auto Car body $3.20 4,000 2,500 523 1,45 3 525 Wheels 4 30 2 9.800 529 Side windows 2 .15 4,300 2,620 2,000 1,800 531 Windshield 25 2 1021 615 Toy truck $6.50 1.70 Cab 3 800 due 9/26 617 Wheels dual 8 sets 25 2 9,900 Wheels single 619 2 30 2 2,500 621 Trailer 2.20 4 4,600 1,200 due 10/3 $4.10 1.80 35 25 1023 Toy robot Body 1 1,500 730 732 734 2 1,600 Arms 3,500 Legs Head 2 4,020 2,150 736 1.10 ToysPhs, Inc.: MRP deliveries from our suppliers. Will they cooperate? Maybe we will have to react faster in laying off and hiring workers in order to keep capacity closer to demand. What do you think of this situation? Is there carry inventory for a year. For parts and components that are ordered, it costs $25 to place each order. When the line is changed over, not only is a setup cost incurred for the labor to change the line but also an order is also triggered for each of the parts that is used to make the final product. The total setup cost of a line changeover is a solution? John answered, therefore the total of these costs. Purchasing does not always buy the exact number of parts that are ordered by the production control depart ment. Adjustments are made to take advantage of price breaks from suppliers or to achieve full-truckload ship ments. As a result, some additional parts might be pur- chased in order to reduce purchasing costs. Also, suppliers do not always ship the component parts when promised. As a result, ToysPlus carries safety stock inventory to protect the master production schedule and to keep the assembly lines running, no matter what. About one week of safety stock is carried to protect for late supplier deliveries. Management has mandated that the assembly lines will not shut down. Dale Long has stated that the company will not lay off You must remember, Andrea, the world is filled with hustlers and liars. The salespeople lie to you about forecasts, so they can have more inventory, just in case they need it. We in purchasing lie to our suppli- ers about when we need the parts, so that we can be sure to get them when we really need them. You pad the production schedule a little bit, just to make sure you can meet the shipments. We all are trying to cover ourselves so that we don't run out of stock There isn't a solution to this problem, because we are dealing with human nature. I hate to say it, but maybe top management's expectations are a bit unrealistic that inventory should be reduced and service improved. How can they expect anyone to accomplish these goals in an environment like this? workers on a week-to-week basis. Thus, if demand should be less than capacity, for example, by 10 percent in a week, production will be scheduled to full capacity to keep the workers busy. If this condition should con- Discussion Questions ull Capacty to keep the workers busy. If this condition should con- tinue for several weeks, workers will be laid off too adjust capacity. In a similar way, workers will be put on over time to meet demand temporarily. But if demand exceeds normal capacity for several weeks, more work ers will then be added. Discussion Questions 1. Calculate economic order quantities for each of the three types of toys. The EOQ formula is recommend ed from the supplement to Chapter 14 that considers uniform lot delivery of the toys. 2. Prepare a master production schedule for the next six weeks using the EOQS calculated in question 1 and a workforce of 10 employees. What inventory turnover ratio is achieved by this master schedule? How does this turnover compare with past levels and with management's goals? 3. Prepare a parts explosion to support the master schedule. What parts should be ordered each week? Are there enough planned orders in time to support A six-week rolling production schedule, based on existing capacity and lead times, is used. Each week one more week is added to keep the total master sched ule horizon at six weeks. Production is adjusted each week in line with available parts, capacity, and observed demand for toys HAPPY HOUR Andrea walked to General Joe's, a favorite watering hole, for happy hour with her friend from purchasing. John White. Andrea began, your master schedule? 4 What should Andrea Meline do to meet the inventory and service goals stated by management? Hint: I the turnover is too low from your first analysis and is not feasible using available parts, try another master schedule that is feasible with reduced production lev els, uses the available parts and has a turnover of 15 5. How should Andrea deal with the organization is- sues presented in this case? John, I don't know what I am going to do. Dale Long has laid the law down that I must reduce inventory and improve service levels. There is no alternative or excuses this time, I must do it! I'm not sure where to start. I would like better sales forecasts, but is that realistic to expect? Can I depend on marketing? I also could reduce inventory by achieving more reliable