Question
Case study Figure 1. demonstrates Phaseouts of ozone-depleting substances since 1987 of the Antarctic ozone hole. Explain the data on the graphics. What is

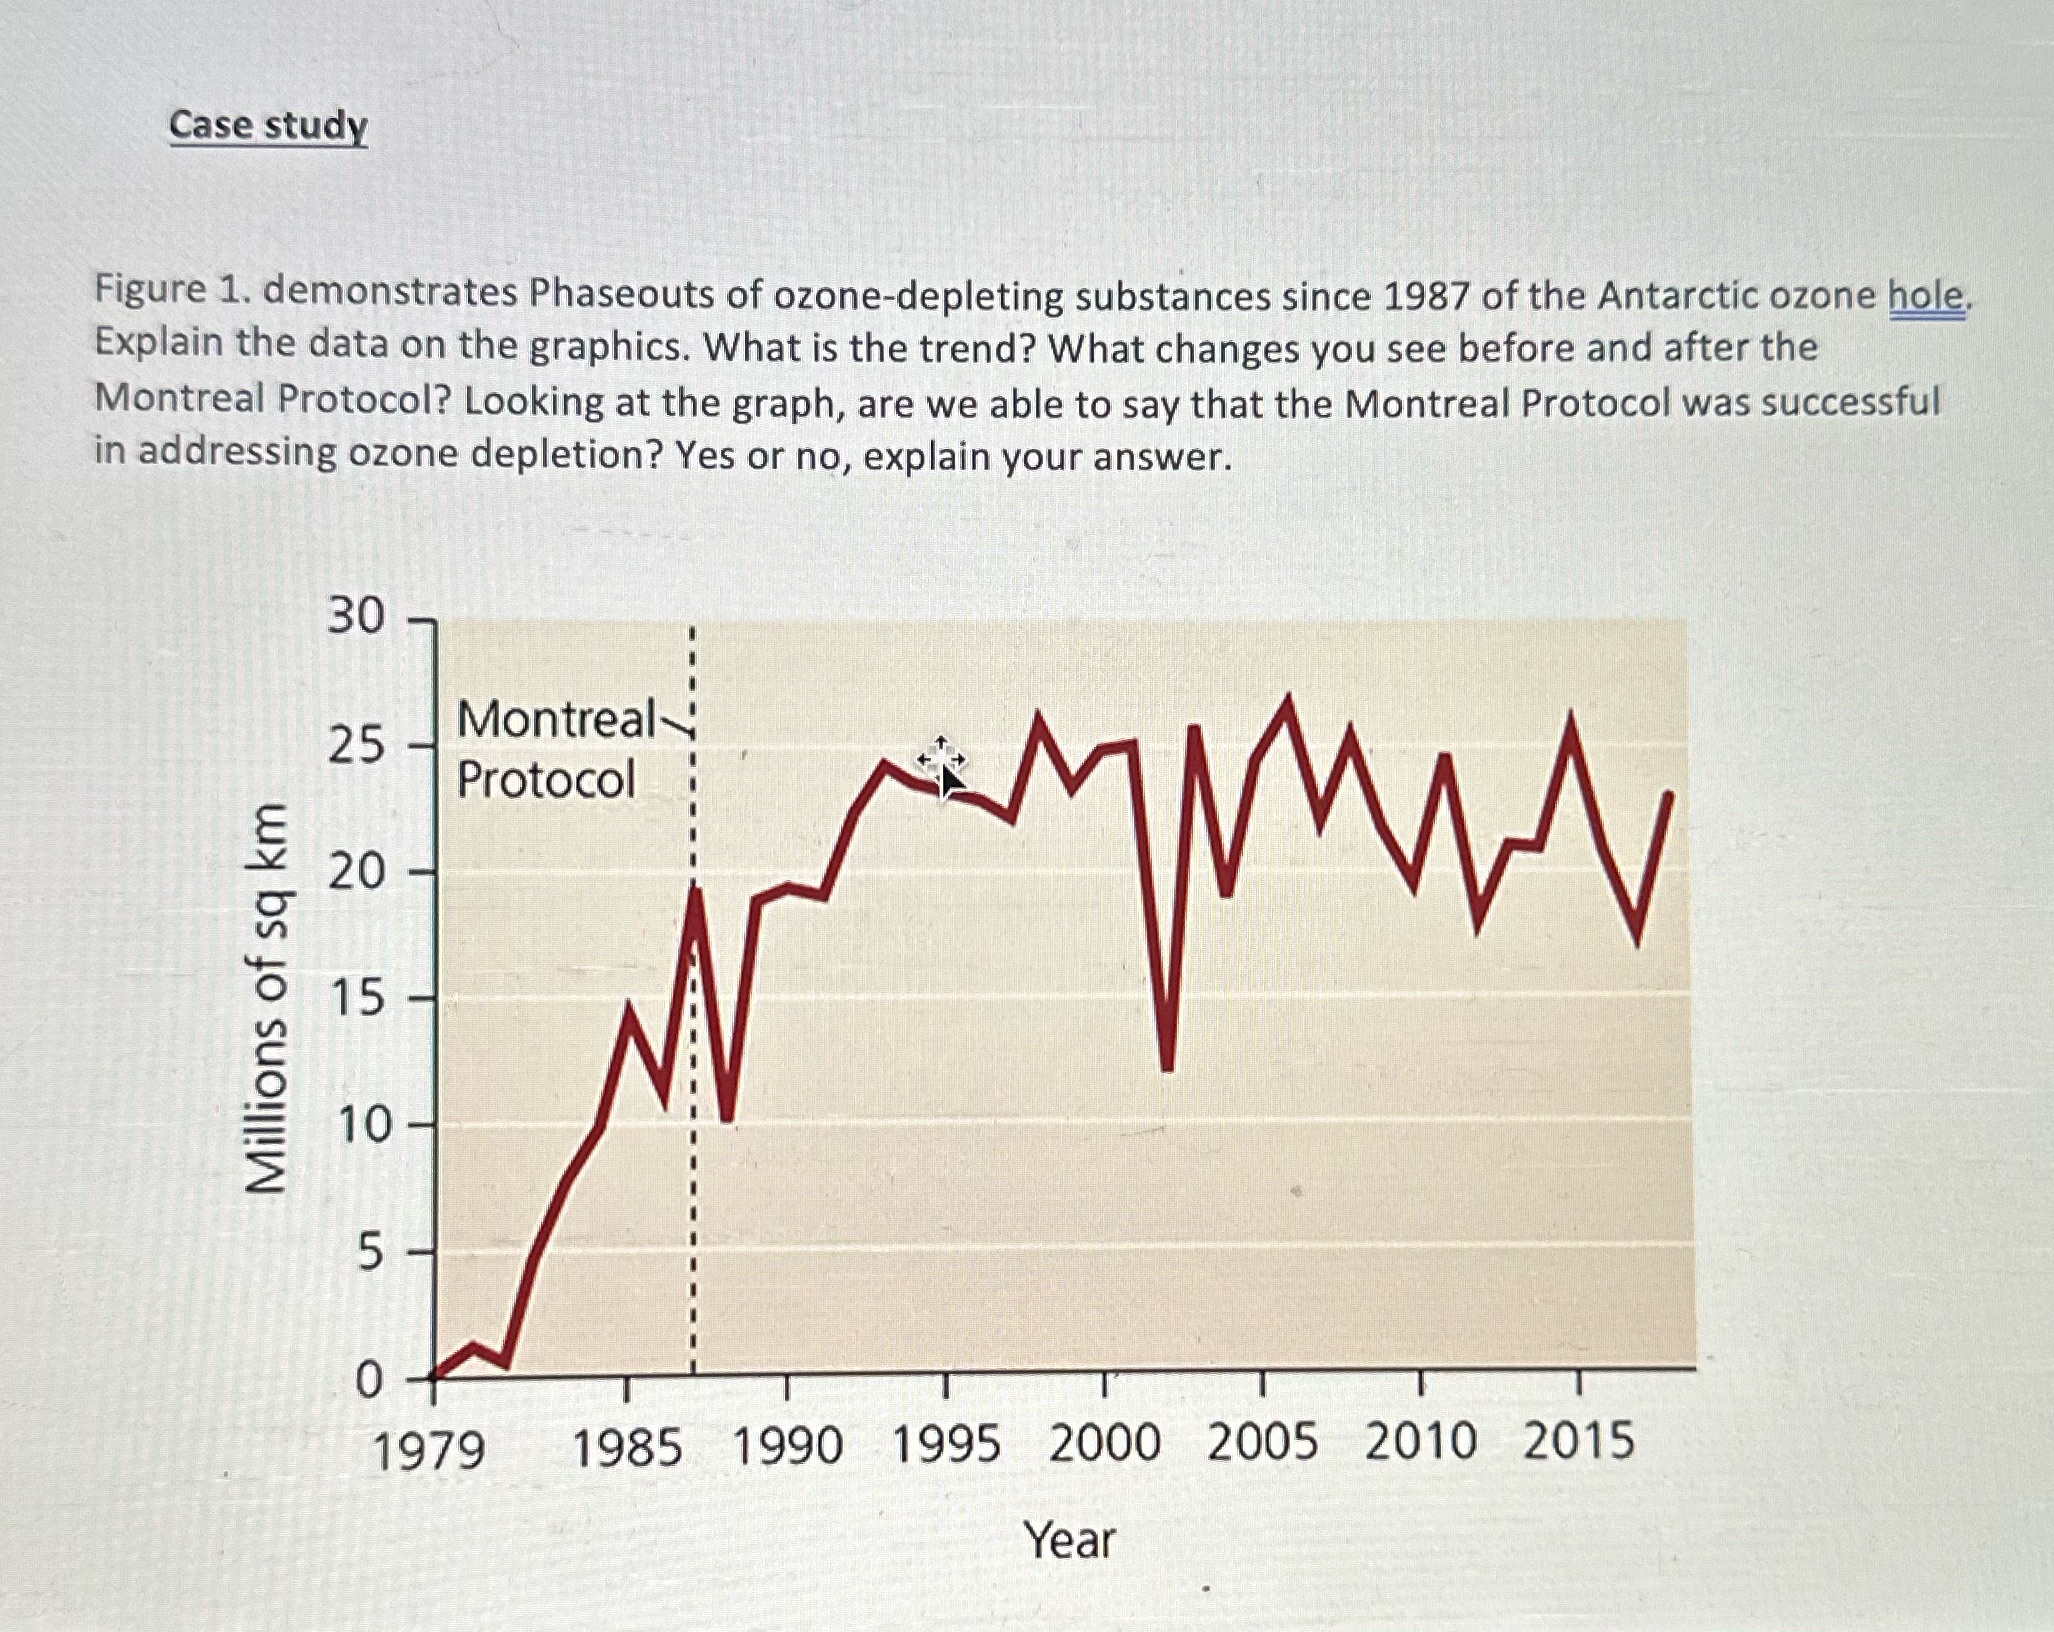
Case study Figure 1. demonstrates Phaseouts of ozone-depleting substances since 1987 of the Antarctic ozone hole. Explain the data on the graphics. What is the trend? What changes you see before and after the Montreal Protocol? Looking at the graph, are we able to say that the Montreal Protocol was successful in addressing ozone depletion? Yes or no, explain your answer. Millions of sq km 30 25 20 15 - 10- 5- 0 Montreal- Protocol 1979 1985 1990 1995 2000 2005 2010 2015 Year
Step by Step Solution
There are 3 Steps involved in it
Step: 1
Yes the Montreal Protocol was successful in addressing ozone depletion The graph you sent shows the size of the Antarctic ozone hole from 1979 to 2015 ...
Get Instant Access to Expert-Tailored Solutions
See step-by-step solutions with expert insights and AI powered tools for academic success
Step: 2

Step: 3

Ace Your Homework with AI
Get the answers you need in no time with our AI-driven, step-by-step assistance
Get StartedRecommended Textbook for
Income Tax Fundamentals 2013
Authors: Gerald E. Whittenburg, Martha Altus Buller, Steven L Gill
31st Edition
1111972516, 978-1285586618, 1285586611, 978-1285613109, 978-1111972516
Students also viewed these Human Resource Management questions
Question
Answered: 1 week ago
Question
Answered: 1 week ago
Question
Answered: 1 week ago
Question
Answered: 1 week ago
Question
Answered: 1 week ago
Question
Answered: 1 week ago
Question
Answered: 1 week ago
Question
Answered: 1 week ago
Question
Answered: 1 week ago
Question
Answered: 1 week ago
Question
Answered: 1 week ago
Question
Answered: 1 week ago
Question
Answered: 1 week ago
Question
Answered: 1 week ago
Question
Answered: 1 week ago
Question
Answered: 1 week ago
Question
Answered: 1 week ago
Question
Answered: 1 week ago
Question
Answered: 1 week ago
Question
Answered: 1 week ago
Question
Answered: 1 week ago
View Answer in SolutionInn App


