

Answered step by step
Verified Expert Solution
Question
1 Approved Answer
CASE STUDY Financial Statements for Walmart Stores Inc. and Macy's Inc. Table 3-7 contains the financial results for Walmart and based on their supply chain
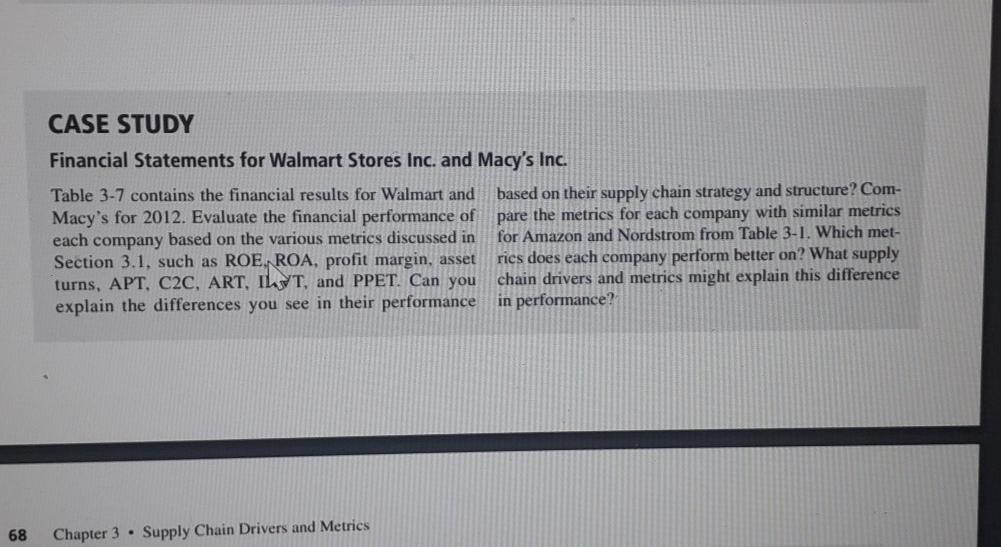
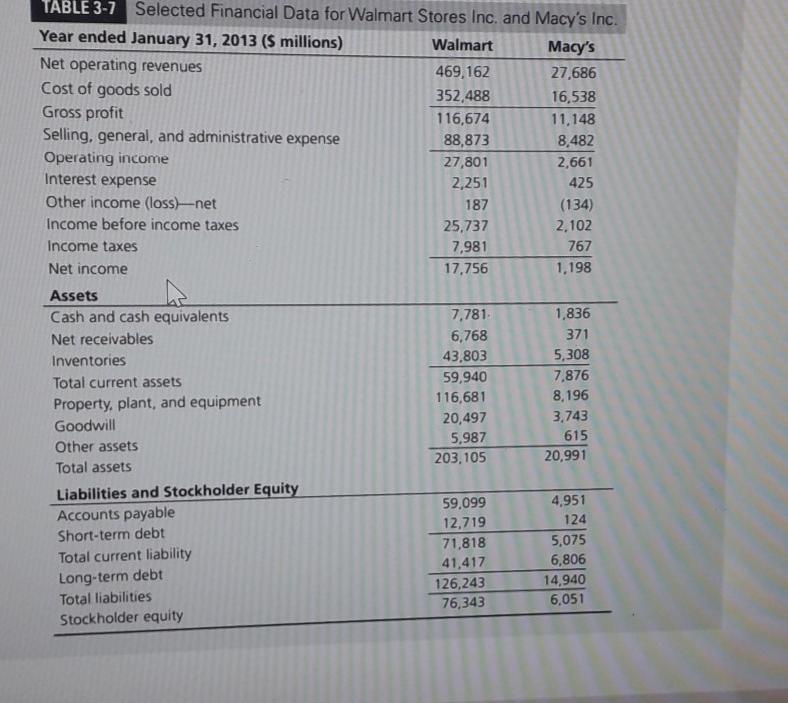
CASE STUDY Financial Statements for Walmart Stores Inc. and Macy's Inc. Table 3-7 contains the financial results for Walmart and based on their supply chain strategy and structure? Com- Macy's for 2012. Evaluate the financial performance of pare the metrics for each company with similar metrics each company based on the various metrics discussed in for Amazon and Nordstrom from Table 3-1. Which met- Section 3.1. such as ROE, ROA, profit margin, asset rics does each company perform better on? What supply turns, APT, C2C, ART, TT, and PPET. Can you chain drivers and metrics might explain this difference explain the differences you see in their performance in performance? 68 Chapter 3 . Supply Chain Drivers and Metrics TABLE 3-7 Selected Financial Data for Walmart Stores Inc. and Macy's Inc. Year ended January 31, 2013 (5 millions) Walmart Macy's Net operating revenues 469,162 27,686 Cost of goods sold 352,488 16,538 Gross profit 116,674 11,148 Selling, general, and administrative expense 88,873 8,482 Operating income 27,801 2,661 Interest expense 2,251 425 Other income (loss)-net 187 (134) Income before income taxes 25,737 2.102 Income taxes 7,981 767 Net income 17.756 1,198 Assets Cash and cash equivalents 7,781 1,836 Net receivables 6,768 371 Inventories 43.803 5,308 Total current assets 59,940 7,876 Property, plant, and equipment 116,681 8,196 Goodwill 20,497 3,743 Other assets 5,987 615 Total assets 203,105 20,991 Liabilities and Stockholder Equity 59,099 4,951 Accounts payable 12,719 124 Short-term debt 71,818 5,075 Total current liability 41,417 6,806 Long-term debt 126,243 14,940 Total liabilities 76,343 6,051 Stockholder equity CASE STUDY Financial Statements for Walmart Stores Inc. and Macy's Inc. Table 3-7 contains the financial results for Walmart and based on their supply chain strategy and structure? Com- Macy's for 2012. Evaluate the financial performance of pare the metrics for each company with similar metrics each company based on the various metrics discussed in for Amazon and Nordstrom from Table 3-1. Which met- Section 3.1. such as ROE, ROA, profit margin, asset rics does each company perform better on? What supply turns, APT, C2C, ART, TT, and PPET. Can you chain drivers and metrics might explain this difference explain the differences you see in their performance in performance? 68 Chapter 3 . Supply Chain Drivers and Metrics TABLE 3-7 Selected Financial Data for Walmart Stores Inc. and Macy's Inc. Year ended January 31, 2013 (5 millions) Walmart Macy's Net operating revenues 469,162 27,686 Cost of goods sold 352,488 16,538 Gross profit 116,674 11,148 Selling, general, and administrative expense 88,873 8,482 Operating income 27,801 2,661 Interest expense 2,251 425 Other income (loss)-net 187 (134) Income before income taxes 25,737 2.102 Income taxes 7,981 767 Net income 17.756 1,198 Assets Cash and cash equivalents 7,781 1,836 Net receivables 6,768 371 Inventories 43.803 5,308 Total current assets 59,940 7,876 Property, plant, and equipment 116,681 8,196 Goodwill 20,497 3,743 Other assets 5,987 615 Total assets 203,105 20,991 Liabilities and Stockholder Equity 59,099 4,951 Accounts payable 12,719 124 Short-term debt 71,818 5,075 Total current liability 41,417 6,806 Long-term debt 126,243 14,940 Total liabilities 76,343 6,051 Stockholder equity
Step by Step Solution
There are 3 Steps involved in it
Step: 1

Get Instant Access to Expert-Tailored Solutions
See step-by-step solutions with expert insights and AI powered tools for academic success
Step: 2

Step: 3
Ace Your Homework with AI
Get the answers you need in no time with our AI-driven, step-by-step assistance
Get Started
EPA Should Improve Timeliness For Resolving Audits Under Appeal
Authors: U.S. Environmental Protection Agency
1st Edition
1500105783, 978-1500105785