Answered step by step
Verified Expert Solution
Question
1 Approved Answer
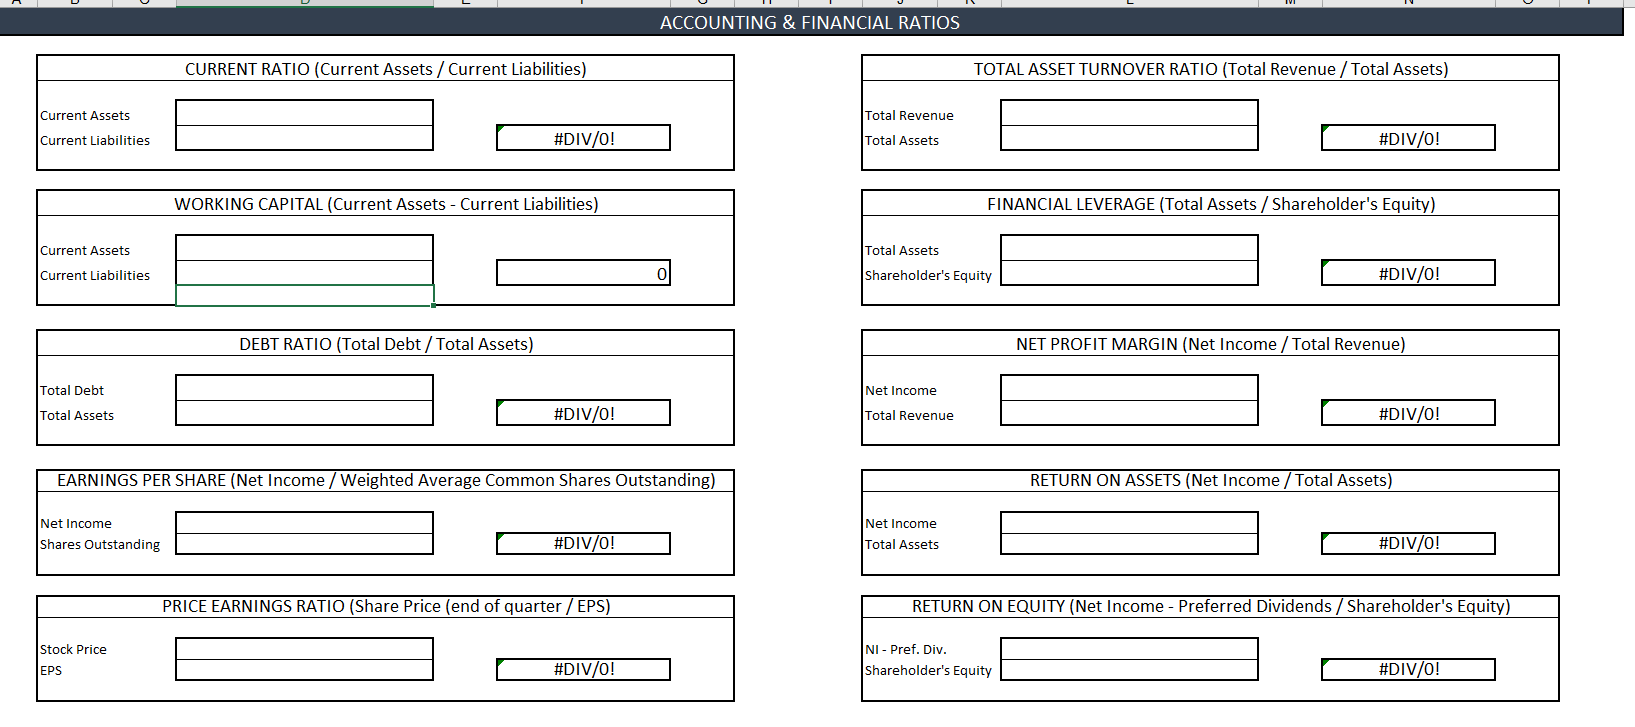
Cash & cash equivalents 17604000000 Marketable securities 13397000000 Accounts receivable, trade, gross 15134000000 Less allowances for doubtful accounts & credit losses 223000000 Accounts receivable, trade

| Cash & cash equivalents | 17604000000 |
| Marketable securities | 13397000000 |
| Accounts receivable, trade, gross | 15134000000 |
| Less allowances for doubtful accounts & credit losses | 223000000 |
| Accounts receivable, trade | 14911000000 |
| Raw materials & supplies | 1587000000 |
| Goods in process | 2164000000 |
| Finished goods | 6636000000 |
| Inventories | 10387000000 |
| Prepaid expenses & other current assets | 3590000000 |
| Assets held for sale | - |
| Total current assets | 59889000000 |
| Property, plant & equipment at cost | 47347000000 |
| Less: accumulated depreciation | 28869000000 |
| Property, plant & equipment, net | 18478000000 |
| Intangible assets, net | 47776000000 |
| Goodwill | 35569000000 |
| Deferred taxes on income | 10646000000 |
| Other assets | 6870000000 |
| Total assets | 179228000000.00 |
| Loans & notes payable | 3798000000 |
| Accounts payable | 8961000000 |
| Accrued liabilities | 13812000000 |
| Accrued rebates, returns & promotions | 12683000000 |
| Accrued compensation & employee related obligations | 3146000000 |
| Accrued taxes on income | 2161000000 |
| Total current liabilities | 44561000000 |
| Notes | 28141000000 |
| Debentures | 1984000000 |
| Zero coupon convertible subordinated debentures | - |
| Other long-term debt | 5000000 |
| Long-term debt | 30130000000 |
| Deferred taxes on income | 7147000000 |
| Employee related obligations | 10171000000 |
| Long-term taxes payable | 5770000000 |
| Other liabilities | 11177000000 |
| Total liabilities | 108956000000.00 |
| Common stock | 3120000000 |
| Foreign currency translation | -9179000000 |
| Gain (loss) on securities | - |
| Employee benefit plans | -6257000000 |
| Gain (loss) on derivatives & hedges | 21000000 |
| Accumulated other comprehensive income (loss) | -15415000000 |
| Retained earnings (accumulated deficit) | 121092000000.00 |
| Less: common stock held in treasury | 38525000000 |
| Total shareholders' equity (deficit) | 70272000000 |
Step by Step Solution
There are 3 Steps involved in it
Step: 1

Get Instant Access to Expert-Tailored Solutions
See step-by-step solutions with expert insights and AI powered tools for academic success
Step: 2

Step: 3

Ace Your Homework with AI
Get the answers you need in no time with our AI-driven, step-by-step assistance
Get Started


