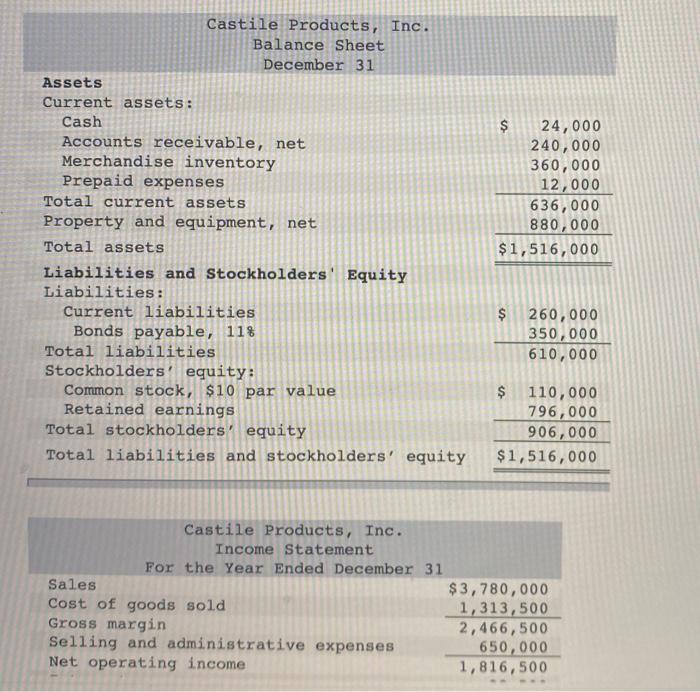
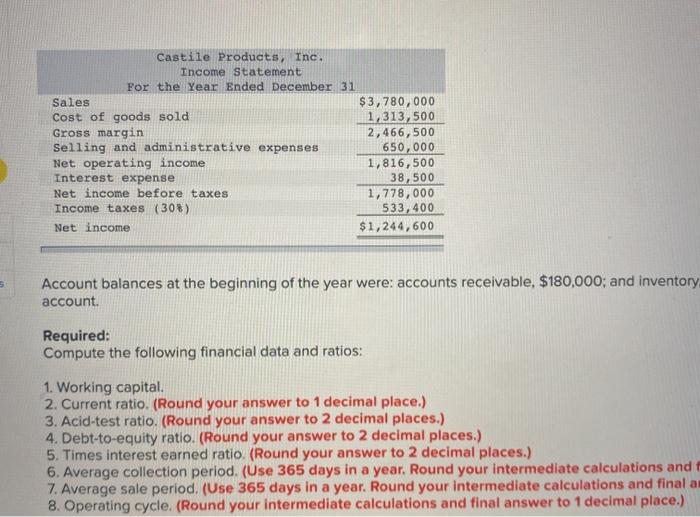
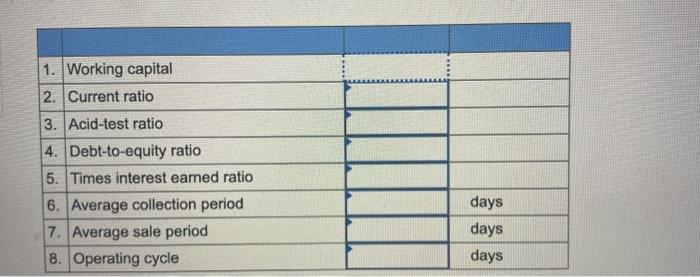
$ Castile Products, Inc. Balance Sheet December 31 Assets Current assets: Cash Accounts receivable, net Merchandise inventory Prepaid expenses Total current assets Property and equipment, net Total assets Liabilities and Stockholders' Equity Liabilities: Current liabilities Bonds payable, 118 Total liabilities Stockholders' equity: Common stock, $10 par value Retained earnings Total stockholders' equity Total liabilities and stockholders' equity $ 24,000 240,000 360,000 12,000 636,000 880,000 $1,516,000 $ 260,000 350,000 610,000 $ 110,000 796,000 906,000 $1,516,000 Castile Products, Inc. Income Statement For the Year Ended December 31 Sales $3,780,000 Cost of goods sold 1,313,500 Gross margin 2,466,500 Selling and administrative expenses 650,000 Net operating income 1,816,500 Castile Products, Inc. Income Statement For the Year Ended December 31 Sales $3,780,000 Cost of goods sold 1,313,500 Gross margin 2,466,500 Selling and administrative expenses 650,000 Net operating income 1,816,500 Interest expense 38,500 Net income before taxes 1,778,000 Income taxes (308) 533, 400 Net income $1,244,600 Account balances at the beginning of the year were: accounts receivable, $180,000; and inventory account. Required: Compute the following financial data and ratios: 1. Working capital. 2. Current ratio. (Round your answer to 1 decimal place.) 3. Acid-test ratio. (Round your answer to 2 decimal places.) 4. Debt-to-equity ratio. (Round your answer to 2 decimal places.) 5. Times interest earned ratio. (Round your answer to 2 decimal places.) 6. Average collection period. (Use 365 days in a year. Round your intermediate calculations and 7. Average sale period. (Use 365 days in a year. Round your intermediate calculations and final am 8. Operating cycle. (Round your intermediate calculations and final answer to 1 decimal place.) 1. Working capital 2. Current ratio 3. Acid-test ratio 4. Debt-to-equity ratio 5. Times interest earned ratio 6. Average collection period 7. Average period 8. Operating cycle days days days