Answered step by step
Verified Expert Solution
Question
1 Approved Answer
Castile Products, Inc. Balance Sheet December 31 Assets Current assets: Cash 21,000 Accounts receivable, net 210,000 Merchandise inventory 320,000 Prepaid expenses 10,000 Total current assets
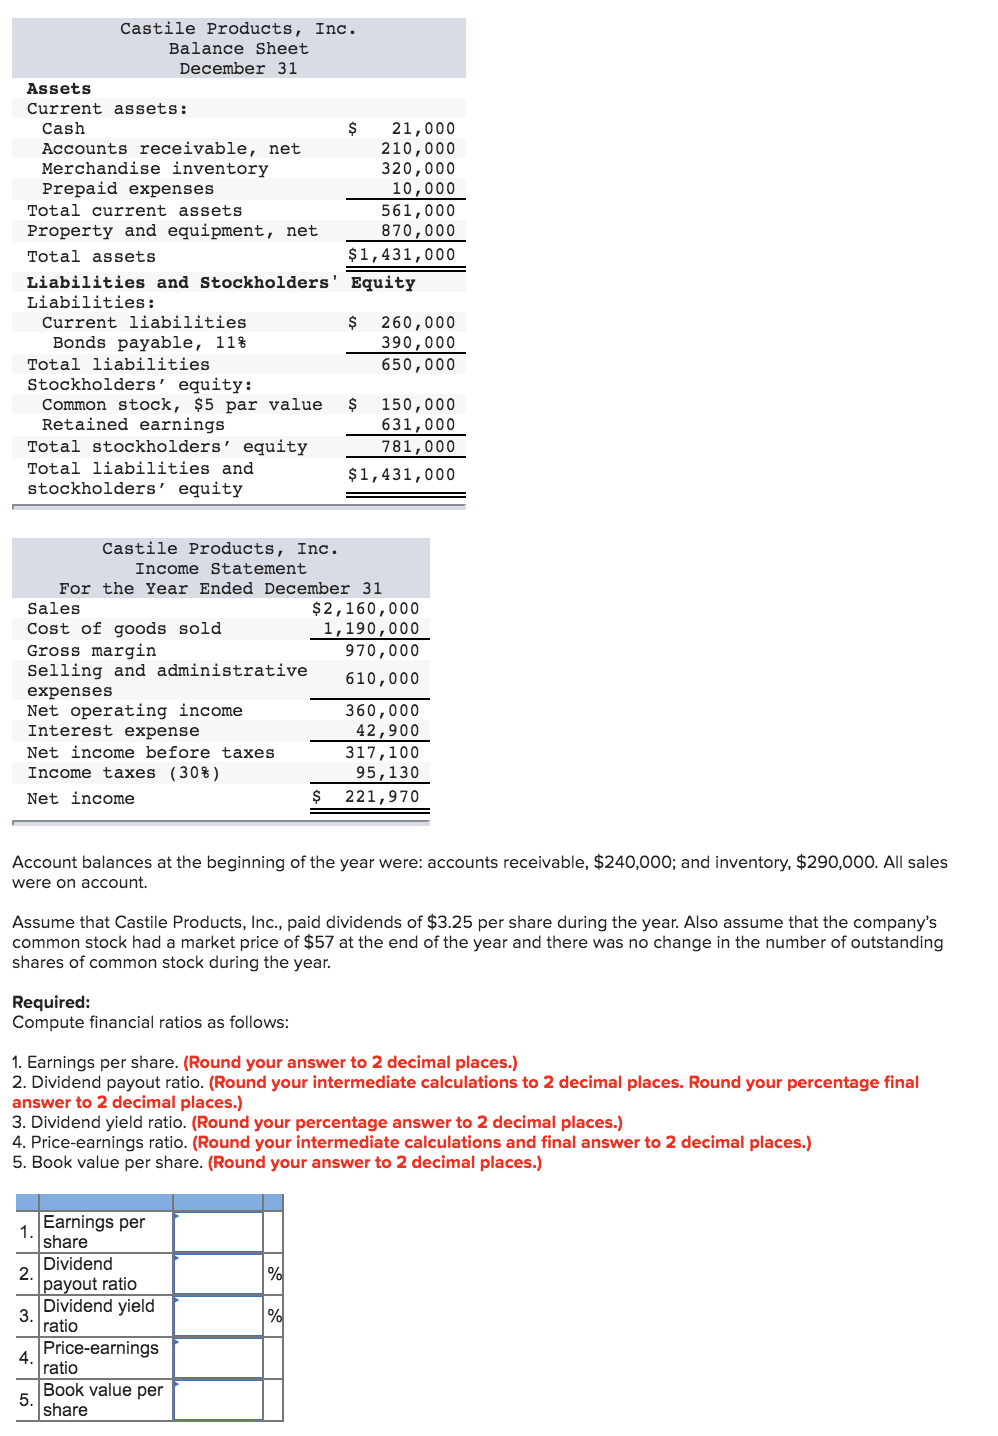
Castile Products, Inc. Balance Sheet December 31 Assets Current assets: Cash 21,000 Accounts receivable, net 210,000 Merchandise inventory 320,000 Prepaid expenses 10,000 Total current assets 561,000 Property and equipment, net 870,000 Total assets $1,431,000 Liabilities and Stockholders' Equity Liabilities: Current liabilities $ 260,000 Bonds payable, 11% 390,000 Total liabilities 650,000 Stockholders' equity: Common stock, $5 par value $ 150,000 Retained earnings 631,000 Total stockholders' equity 781,000 Total liabilities and $1,431,000 stockholders' equity Castile Products, Inc. Income Statement For the Year Ended December 31 Sales $2,160,000 Cost of goods sold 1,190,000 Gross margin 970,000 Selling and administrative 610,000 expenses Net operating income 360,000 Interest expense 42,900 Net income before taxes 317,100 Income taxes (30%) 95,130 Net income $ 221,970 Account balances at the beginning of the year were: accounts receivable, $240,000; and inventory, $290,000. All sales were on account. Assume that Castile Products, Inc., paid dividends of $3.25 per share during the year. Also assume that the company's common stock had a market price of $57 at the end of the year and there was no change in the number of outstanding shares of common stock during the year. Required: Compute financial ratios as follows: 1. Earnings per share. (Round your answer to 2 decimal places.) 2. Dividend payout ratio. (Round your intermediate calculations to 2 decimal places. Round your percentage final answer to 2 decimal places.) 3. Dividend yield ratio. (Round your percentage answer to 2 decimal places.) 4. Price-earnings ratio. (Round your intermediate calculations and final answer to 2 decimal places.) 5. Book value per share. (Round your answer to 2 decimal places.) 1. 2. % 3. Earnings per share Dividend payout ratio Dividend yield ratio Price-earnings ratio Book value per share % 4. 5
Step by Step Solution
There are 3 Steps involved in it
Step: 1
Get Instant Access to Expert-Tailored Solutions
See step-by-step solutions with expert insights and AI powered tools for academic success
Step: 2
Step: 3
Ace Your Homework with AI
Get the answers you need in no time with our AI-driven, step-by-step assistance
Get Started