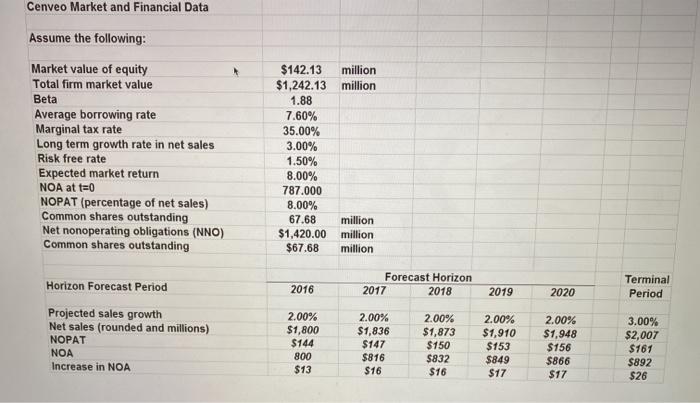
Cerveo generated the attached market and financial data for use in forecasting its share price. C/O Free Cash Flow Model Data Set(1).jpg What is the forecasted stock price per share of the Company at the beginning of 2016 assuming a WACC of 6% and an increasing perpetuity (continuing value) of FCFF at the terminal period of $1.35 billion? 3. Between $2.75 and $3.00 per share b. Between $2.00 and $2.50 per share Between $3.00 and $3.25 per share d. Between $2.50 and $2.75 per share Cenveo Market and Financial Data Assume the following: Market value of equity Total firm market value Beta Average borrowing rate Marginal tax rate Long term growth rate in net sales Risk free rate Expected market return NOA at t=0 NOPAT (percentage of net sales) Common shares outstanding Net nonoperating obligations (NNO) Common shares outstanding $142.13 million $1,242.13 million 1.88 7.60% 35.00% 3.00% 1.50% 8.00% 787.000 8.00% 67.68 million $1,420.00 million $67.68 million 2016 Forecast Horizon 2017 2018 2019 2020 Terminal Period Horizon Forecast Period Projected sales growth Net sales (rounded and millions) NOPAT NOA Increase in NOA 2.00% $1,800 $144 800 $13 2.00% $1,836 $147 $816 $16 2.00% $1,873 $150 $832 $16 2.00% $1,910 $153 $849 $17 2.00% $1,948 $156 $866 $17 3.00% $2,007 $161 $892 $26 Cerveo generated the attached market and financial data for use in forecasting its share price. C/O Free Cash Flow Model Data Set(1).jpg What is the forecasted stock price per share of the Company at the beginning of 2016 assuming a WACC of 6% and an increasing perpetuity (continuing value) of FCFF at the terminal period of $1.35 billion? 3. Between $2.75 and $3.00 per share b. Between $2.00 and $2.50 per share Between $3.00 and $3.25 per share d. Between $2.50 and $2.75 per share Cenveo Market and Financial Data Assume the following: Market value of equity Total firm market value Beta Average borrowing rate Marginal tax rate Long term growth rate in net sales Risk free rate Expected market return NOA at t=0 NOPAT (percentage of net sales) Common shares outstanding Net nonoperating obligations (NNO) Common shares outstanding $142.13 million $1,242.13 million 1.88 7.60% 35.00% 3.00% 1.50% 8.00% 787.000 8.00% 67.68 million $1,420.00 million $67.68 million 2016 Forecast Horizon 2017 2018 2019 2020 Terminal Period Horizon Forecast Period Projected sales growth Net sales (rounded and millions) NOPAT NOA Increase in NOA 2.00% $1,800 $144 800 $13 2.00% $1,836 $147 $816 $16 2.00% $1,873 $150 $832 $16 2.00% $1,910 $153 $849 $17 2.00% $1,948 $156 $866 $17 3.00% $2,007 $161 $892 $26


