

Question
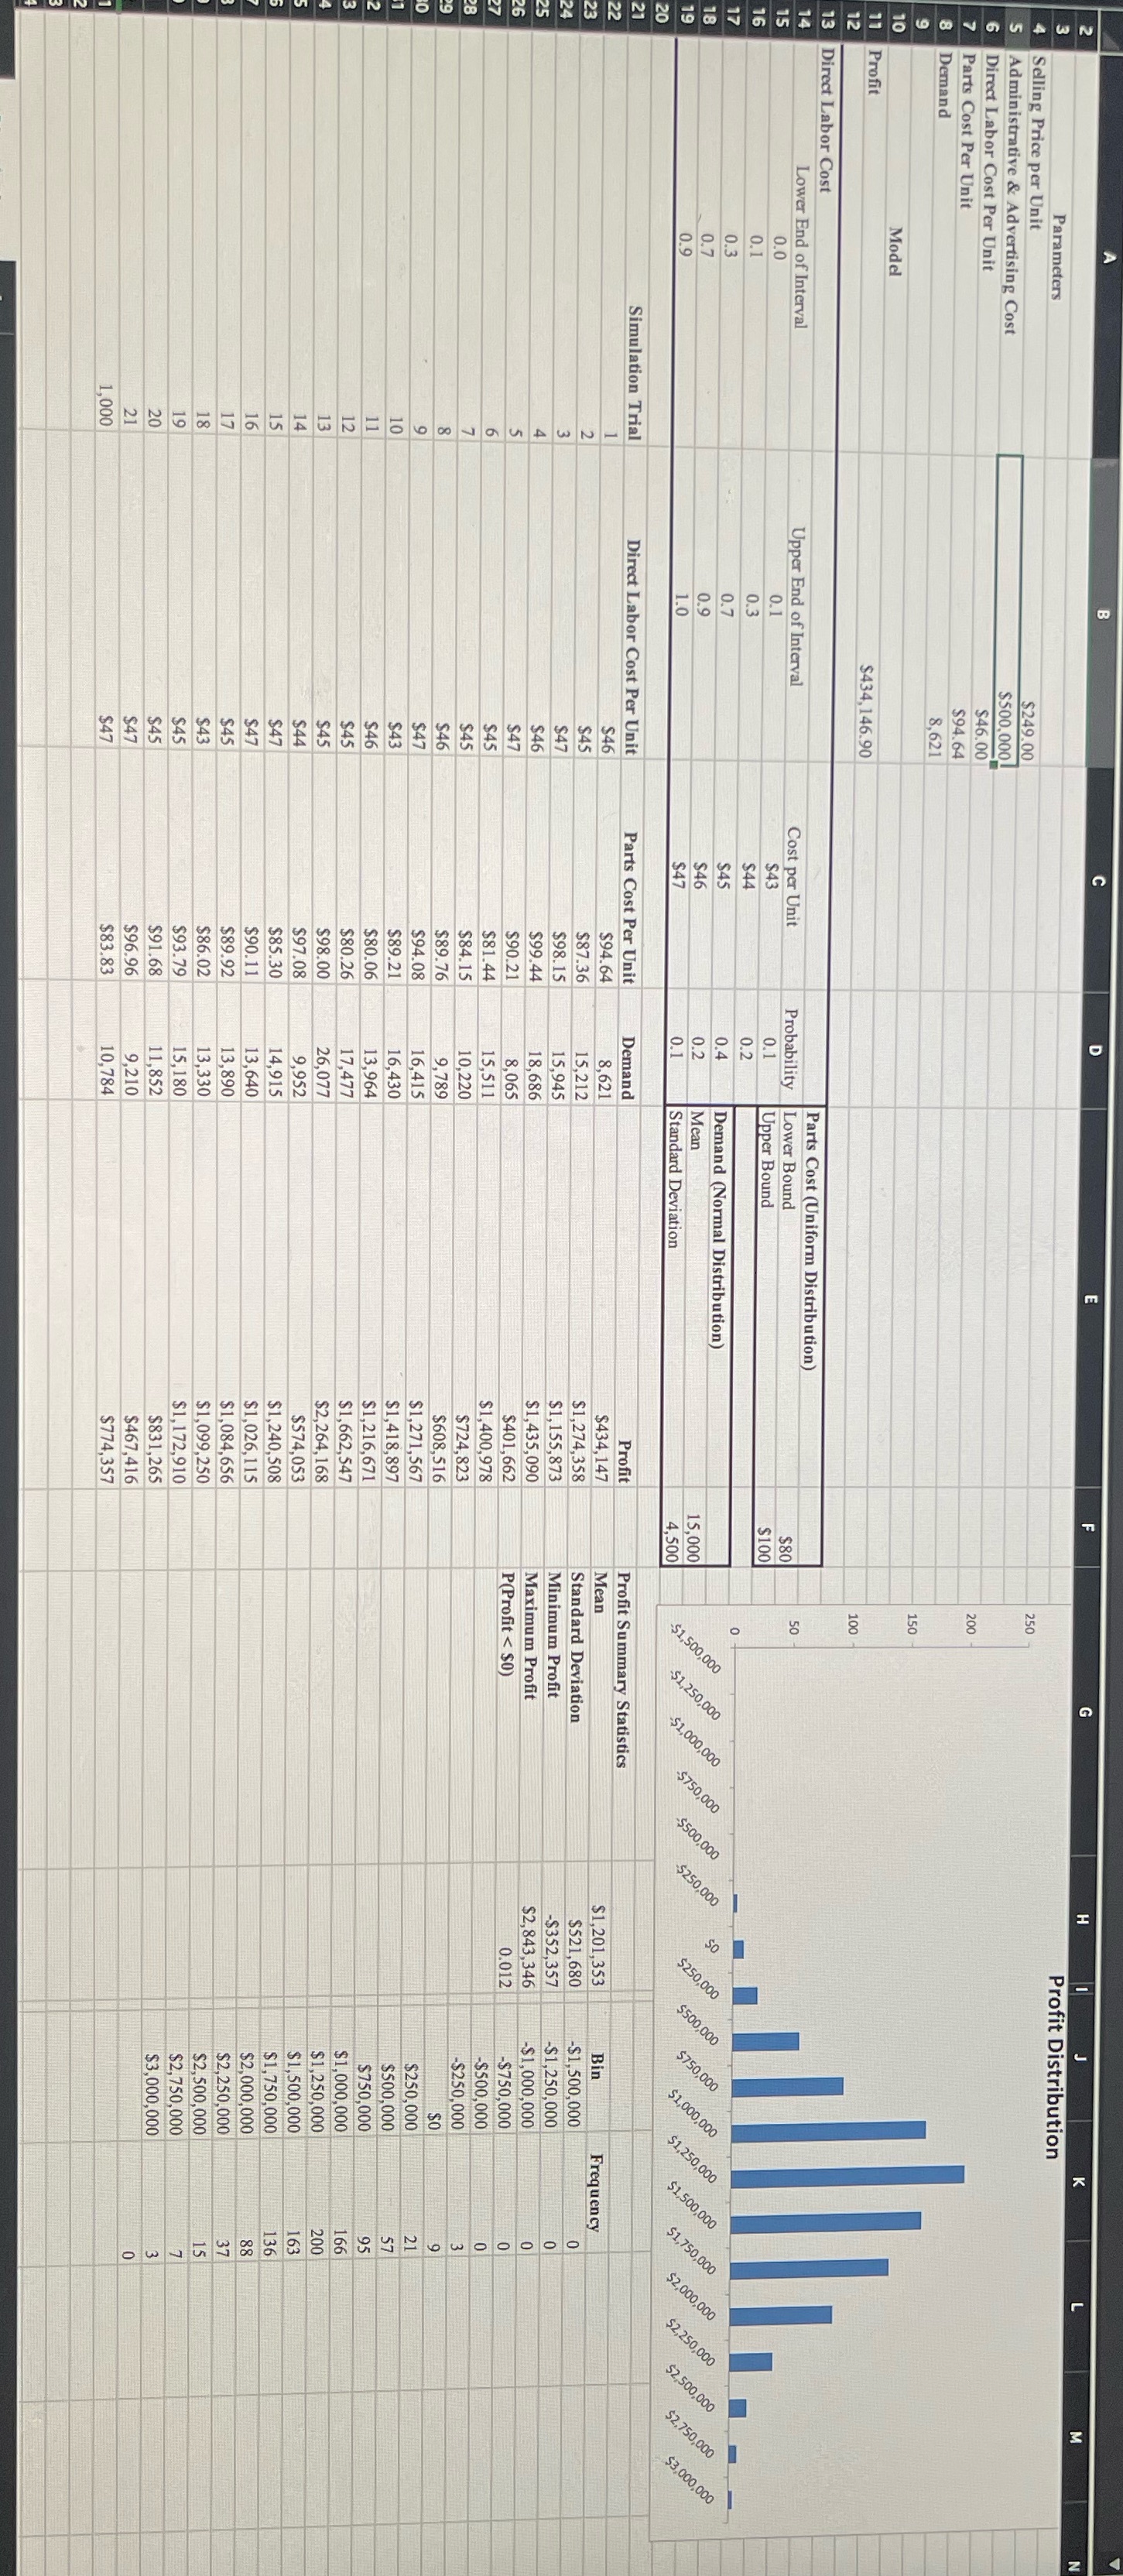
Change Administrative & Advertising Cost value to $500,000. Repeatedly press function key F9 to generate new random numbers. What happens to the Profit Distribution? Specifically
Change "Administrative & Advertising Cost" value to $500,000. Repeatedly press function key F9 to generate new random numbers. What happens to the Profit Distribution? Specifically explain the reason for the change.Change the "Administrative & Advertising Cost" value back to $1,000,000. Change the Lower Bound value of the Parts Cost to $50. Change the Upper Bound value of the Parts Cost to $170. Repeatedly press function key F9 to generate new random numbers. What happens to the Profit Distribution? Specifically explain the reason for the change.Change the Lower Bound value of the Parts Cost back to $80. Change the Upper Bound value of the Parts Cost to $100. Change the Standard Deviation value of the Demand to 1,000. Repeatedly press function key F9 to generate new random numbers. What happens to the Profit Distribution? Specifically explain the reason for the change.Change the Standard Deviation value of the Demand back to 4,500. Change the Selling Price per Unit to $190. Repeatedly press function key F9 to generate new random numbers. What happens to the Profit Distribution? Specifically explain the reason for the change.
Step by Step Solution
There are 3 Steps involved in it
Step: 1

Get Instant Access to Expert-Tailored Solutions
See step-by-step solutions with expert insights and AI powered tools for academic success
Step: 2

Step: 3
Ace Your Homework with AI
Get the answers you need in no time with our AI-driven, step-by-step assistance
Get Started
Algebra And Trigonometry, Enhanced
Authors: Cynthia Y Young
4th Edition
1119320860, 9781119320869