

Answered step by step
Verified Expert Solution
Question
1 Approved Answer
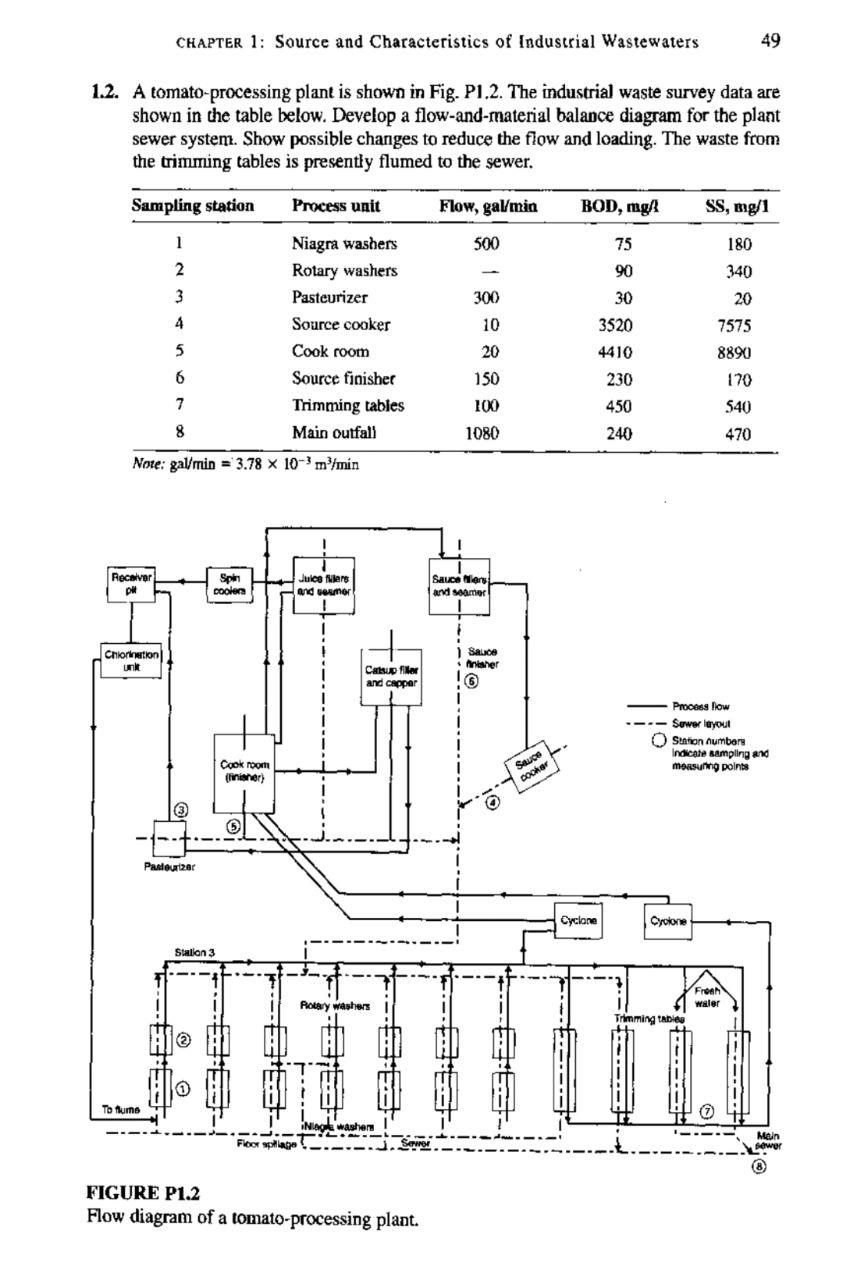
CHAPTER 1: Source and Characteristics of Industrial Wastewaters 49 1.2. A tomato-processing plant is shown in Fig. P1.2. The industrial waste survey data are shown
Step by Step Solution
There are 3 Steps involved in it
Step: 1

Get Instant Access to Expert-Tailored Solutions
See step-by-step solutions with expert insights and AI powered tools for academic success
Step: 2

Step: 3
Ace Your Homework with AI
Get the answers you need in no time with our AI-driven, step-by-step assistance
Get Started
Chemical Engineering Design
Authors: R K Sinnott, Gavin Towler
5th Edition
0750685514, 9780750685511