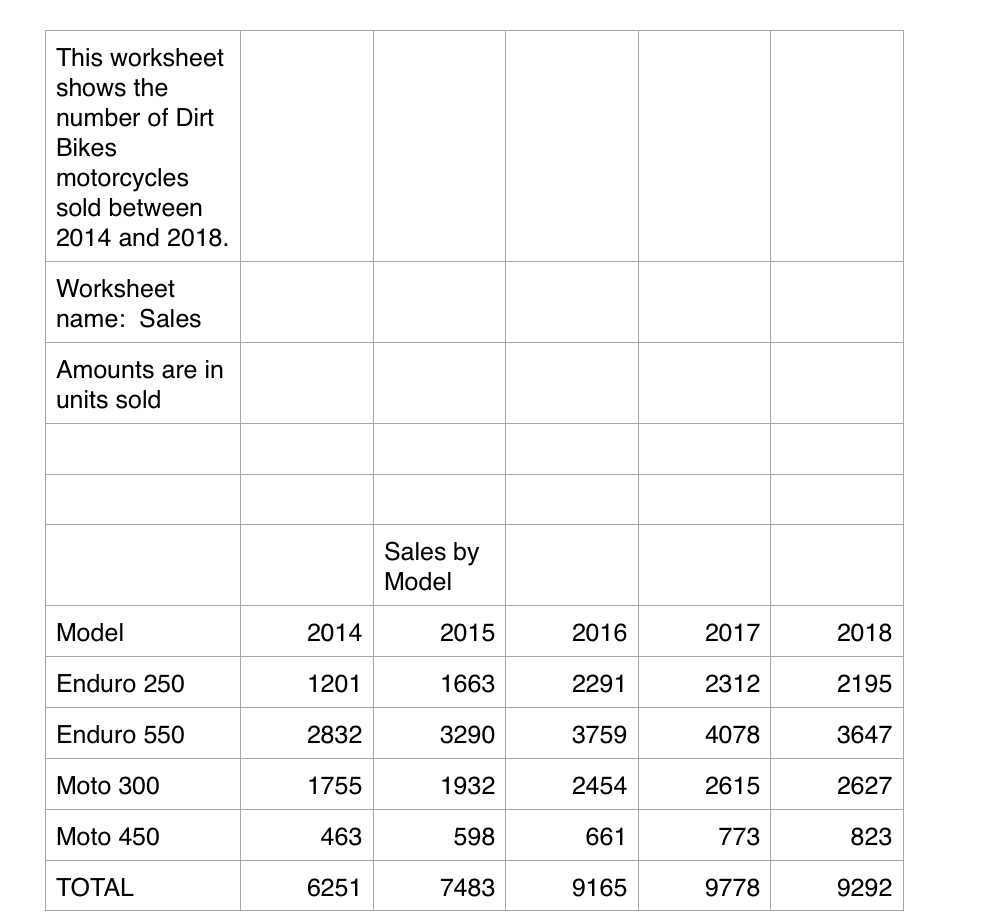
Chapter 2 Running Case Assignment: Analyzing Financial Performance Software skills: Spreadsheet charts and formulas Business skills: Financial statement analysis As part of your analysis of the company for management, you have been asked to analyze data on Dirt Bikes's financial performance. Review Dirt Bikes's selected financial and sales data in the Introduction to Dirt Bikes, which can be found in MyLabMIS. There you will find Dirt Bikes's income statement and summary balance sheet data from 2016 to 2018, annual sales of Dirt Bikes models between 2014 and 2018 (measured in units sold), and total domestic versus international sales between 2014 and 2018 (measured in units sold). Use your spreadsheet software to create graphs of Dirt Bikes's sales history from 2014 to 2018 and its domestic versus international sales from 2014 to 2018. Select the type of graph that is most appropriate for presenting the data you are analyzing. Use the instructions in MyLabMIS and your spreadsheet software to calculate the gross and net margins in Dirt Bikes's income statements from 2016 to 2018. You can also create graphs showing trends in selected pieces of Dirt Bikes's income statement and balance sheet data if you wish. (You may want to rearrange the historical ordering of the data if you decide to do this.) Prepare an addition to your management report that answers these questions: What are Dirt Bikes's best- and worst-performing products? What is the proportion of domestic to international sales? Have international sales grown relative to domestic sales? Are sales (revenues) growing steadily, and, if so, at what rate? What is the cost of goods sold compared to revenues? Is it increasing or decreasing? Are the firm's gross and net margins increasing or decreasing? Are the firm's operating expenses increasing or decreasing? Is the firm heavily in debt? Does it have assets to pay for expenses and to finance the development of new products and information systems? (Optional) Use electronic presentation software to summarize your analysis of Dirt Bikes's performance for management. This worksheet shows the number of Dirt Bikes motorcycles sold between 2014 and 2018. Worksheet name: Sales Amounts are in units sold Sales by Model Model 2014 2015 2016 2017 2018 Enduro 250 1201 1663 2291 2312 2195 Enduro 550 2832 3290 3759 4078 3647 Moto 300 1755 1932 2454 2615 2627 Moto 450 463 598 661 773 823 TOTAL 6251 7483 9165 9778 9292 Chapter 2 Running Case Assignment: Analyzing Financial Performance Software skills: Spreadsheet charts and formulas Business skills: Financial statement analysis As part of your analysis of the company for management, you have been asked to analyze data on Dirt Bikes's financial performance. Review Dirt Bikes's selected financial and sales data in the Introduction to Dirt Bikes, which can be found in MyLabMIS. There you will find Dirt Bikes's income statement and summary balance sheet data from 2016 to 2018, annual sales of Dirt Bikes models between 2014 and 2018 (measured in units sold), and total domestic versus international sales between 2014 and 2018 (measured in units sold). Use your spreadsheet software to create graphs of Dirt Bikes's sales history from 2014 to 2018 and its domestic versus international sales from 2014 to 2018. Select the type of graph that is most appropriate for presenting the data you are analyzing. Use the instructions in MyLabMIS and your spreadsheet software to calculate the gross and net margins in Dirt Bikes's income statements from 2016 to 2018. You can also create graphs showing trends in selected pieces of Dirt Bikes's income statement and balance sheet data if you wish. (You may want to rearrange the historical ordering of the data if you decide to do this.) Prepare an addition to your management report that answers these questions: What are Dirt Bikes's best- and worst-performing products? What is the proportion of domestic to international sales? Have international sales grown relative to domestic sales? Are sales (revenues) growing steadily, and, if so, at what rate? What is the cost of goods sold compared to revenues? Is it increasing or decreasing? Are the firm's gross and net margins increasing or decreasing? Are the firm's operating expenses increasing or decreasing? Is the firm heavily in debt? Does it have assets to pay for expenses and to finance the development of new products and information systems? (Optional) Use electronic presentation software to summarize your analysis of Dirt Bikes's performance for management. This worksheet shows the number of Dirt Bikes motorcycles sold between 2014 and 2018. Worksheet name: Sales Amounts are in units sold Sales by Model Model 2014 2015 2016 2017 2018 Enduro 250 1201 1663 2291 2312 2195 Enduro 550 2832 3290 3759 4078 3647 Moto 300 1755 1932 2454 2615 2627 Moto 450 463 598 661 773 823 TOTAL 6251 7483 9165 9778 9292