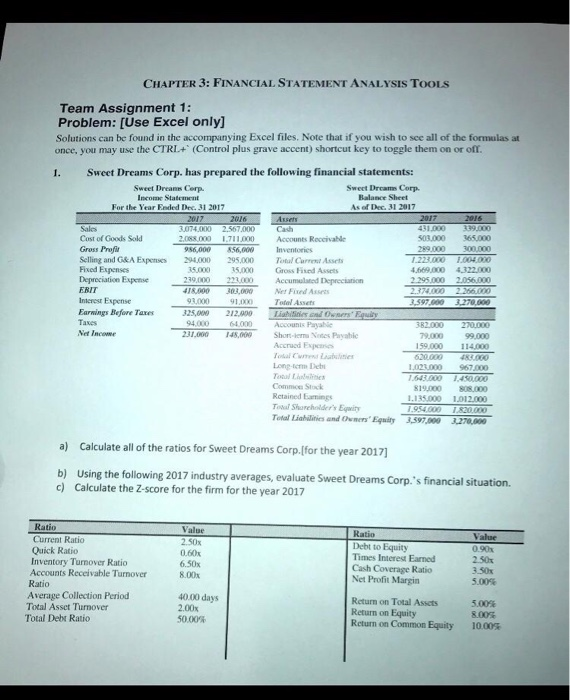
CHAPTER 3: FINANCIAL STATEMENT ANALYSIS TooLS Team Assignment 1: Problem: [Use Excel only] Solutions can be found in the accompanying Excel files. Note that if you wish to see all of the formulas at once, you may use the CTRL (Control plus grave accent) shortcut key to toggle them on or off Sweet Dreams Corp. has prepared the following financial statements: 1. Sweet Dreams Cerp. Income Statement For the Year Ended Dec. 31 2017 Sweet Drcame Corp. Balance Sheet As of Dec. 31 2017 2017 074.000 2.567.000 2016 Sales Cost of Goods Sold Gress Profit 503,000 65000 89000 300,000 1 223,000 004 000 4669,000 4322.000 2295,000 2056000 2.08800 171100 0 Accounts Reccivable Inventories 956,000856,000 Selling and GKA Expenss 294.00 295,000 Tot Curret Aset 3500000 Grss Fised Assets Fixed Expenses Depreciation Expense ERIT Interest Expense Earnings Before Taxes 239.000 223,000 Acumulated Deprecianion 18,000303,000 t Fixed As 93,000 91,000 Totel Assets 325,0 20 Lnes ond Owsers' Equisy 64.000 Accounis Payabe 82.000 270000 Net Income 231,000 148, Shor-ema Nodes Payablc 79,00099.000 159.000 114.000 620,000 48300o 023,000 967000 543,000 1.450.000 19,000 88.000 135000 1012.000 Accrucd Expes Long-icrm De Common Stock Rctained Eamings Tosal Sharehold's Eqwity Total Liabilinies and Owmers' Equity 3,597,000 3,27e,000 a) Calculate all of the ratios for Sweet Dreams Corp.lfor the year 2017 Using the following 2017 industry averages, evaluate Sweet Dreams Corp.'s financial situation. Calculate the Z-score for the firm for the year 2017 b) c) Ratio Current Ratio Quick Ratio Inventory Tunover Ratio Accounts Receivable Turnover Ratio Average Collection Period Value 2.50x 0.60x 6.50x 8.00x Ratio Debt to Equity Times Interest Earned Cash Coverage Ratio Net Profit Margin Value 0.90% 230 3.30x 40.00 days 2.00x 50.00% Return on Total Assets Return on Equity Return on Common Equity 5.0% 8005 1000 Total Asset Turnover Total Debt Ratio CHAPTER 3: FINANCIAL STATEMENT ANALYSIS TooLS Team Assignment 1: Problem: [Use Excel only] Solutions can be found in the accompanying Excel files. Note that if you wish to see all of the formulas at once, you may use the CTRL (Control plus grave accent) shortcut key to toggle them on or off Sweet Dreams Corp. has prepared the following financial statements: 1. Sweet Dreams Cerp. Income Statement For the Year Ended Dec. 31 2017 Sweet Drcame Corp. Balance Sheet As of Dec. 31 2017 2017 074.000 2.567.000 2016 Sales Cost of Goods Sold Gress Profit 503,000 65000 89000 300,000 1 223,000 004 000 4669,000 4322.000 2295,000 2056000 2.08800 171100 0 Accounts Reccivable Inventories 956,000856,000 Selling and GKA Expenss 294.00 295,000 Tot Curret Aset 3500000 Grss Fised Assets Fixed Expenses Depreciation Expense ERIT Interest Expense Earnings Before Taxes 239.000 223,000 Acumulated Deprecianion 18,000303,000 t Fixed As 93,000 91,000 Totel Assets 325,0 20 Lnes ond Owsers' Equisy 64.000 Accounis Payabe 82.000 270000 Net Income 231,000 148, Shor-ema Nodes Payablc 79,00099.000 159.000 114.000 620,000 48300o 023,000 967000 543,000 1.450.000 19,000 88.000 135000 1012.000 Accrucd Expes Long-icrm De Common Stock Rctained Eamings Tosal Sharehold's Eqwity Total Liabilinies and Owmers' Equity 3,597,000 3,27e,000 a) Calculate all of the ratios for Sweet Dreams Corp.lfor the year 2017 Using the following 2017 industry averages, evaluate Sweet Dreams Corp.'s financial situation. Calculate the Z-score for the firm for the year 2017 b) c) Ratio Current Ratio Quick Ratio Inventory Tunover Ratio Accounts Receivable Turnover Ratio Average Collection Period Value 2.50x 0.60x 6.50x 8.00x Ratio Debt to Equity Times Interest Earned Cash Coverage Ratio Net Profit Margin Value 0.90% 230 3.30x 40.00 days 2.00x 50.00% Return on Total Assets Return on Equity Return on Common Equity 5.0% 8005 1000 Total Asset Turnover Total Debt Ratio