

Question
Chapter 4 Qualitative Research 137 Exercise One: Frequency Counts Using SPSS, run a frequency count of all of the variables except the first variable, which
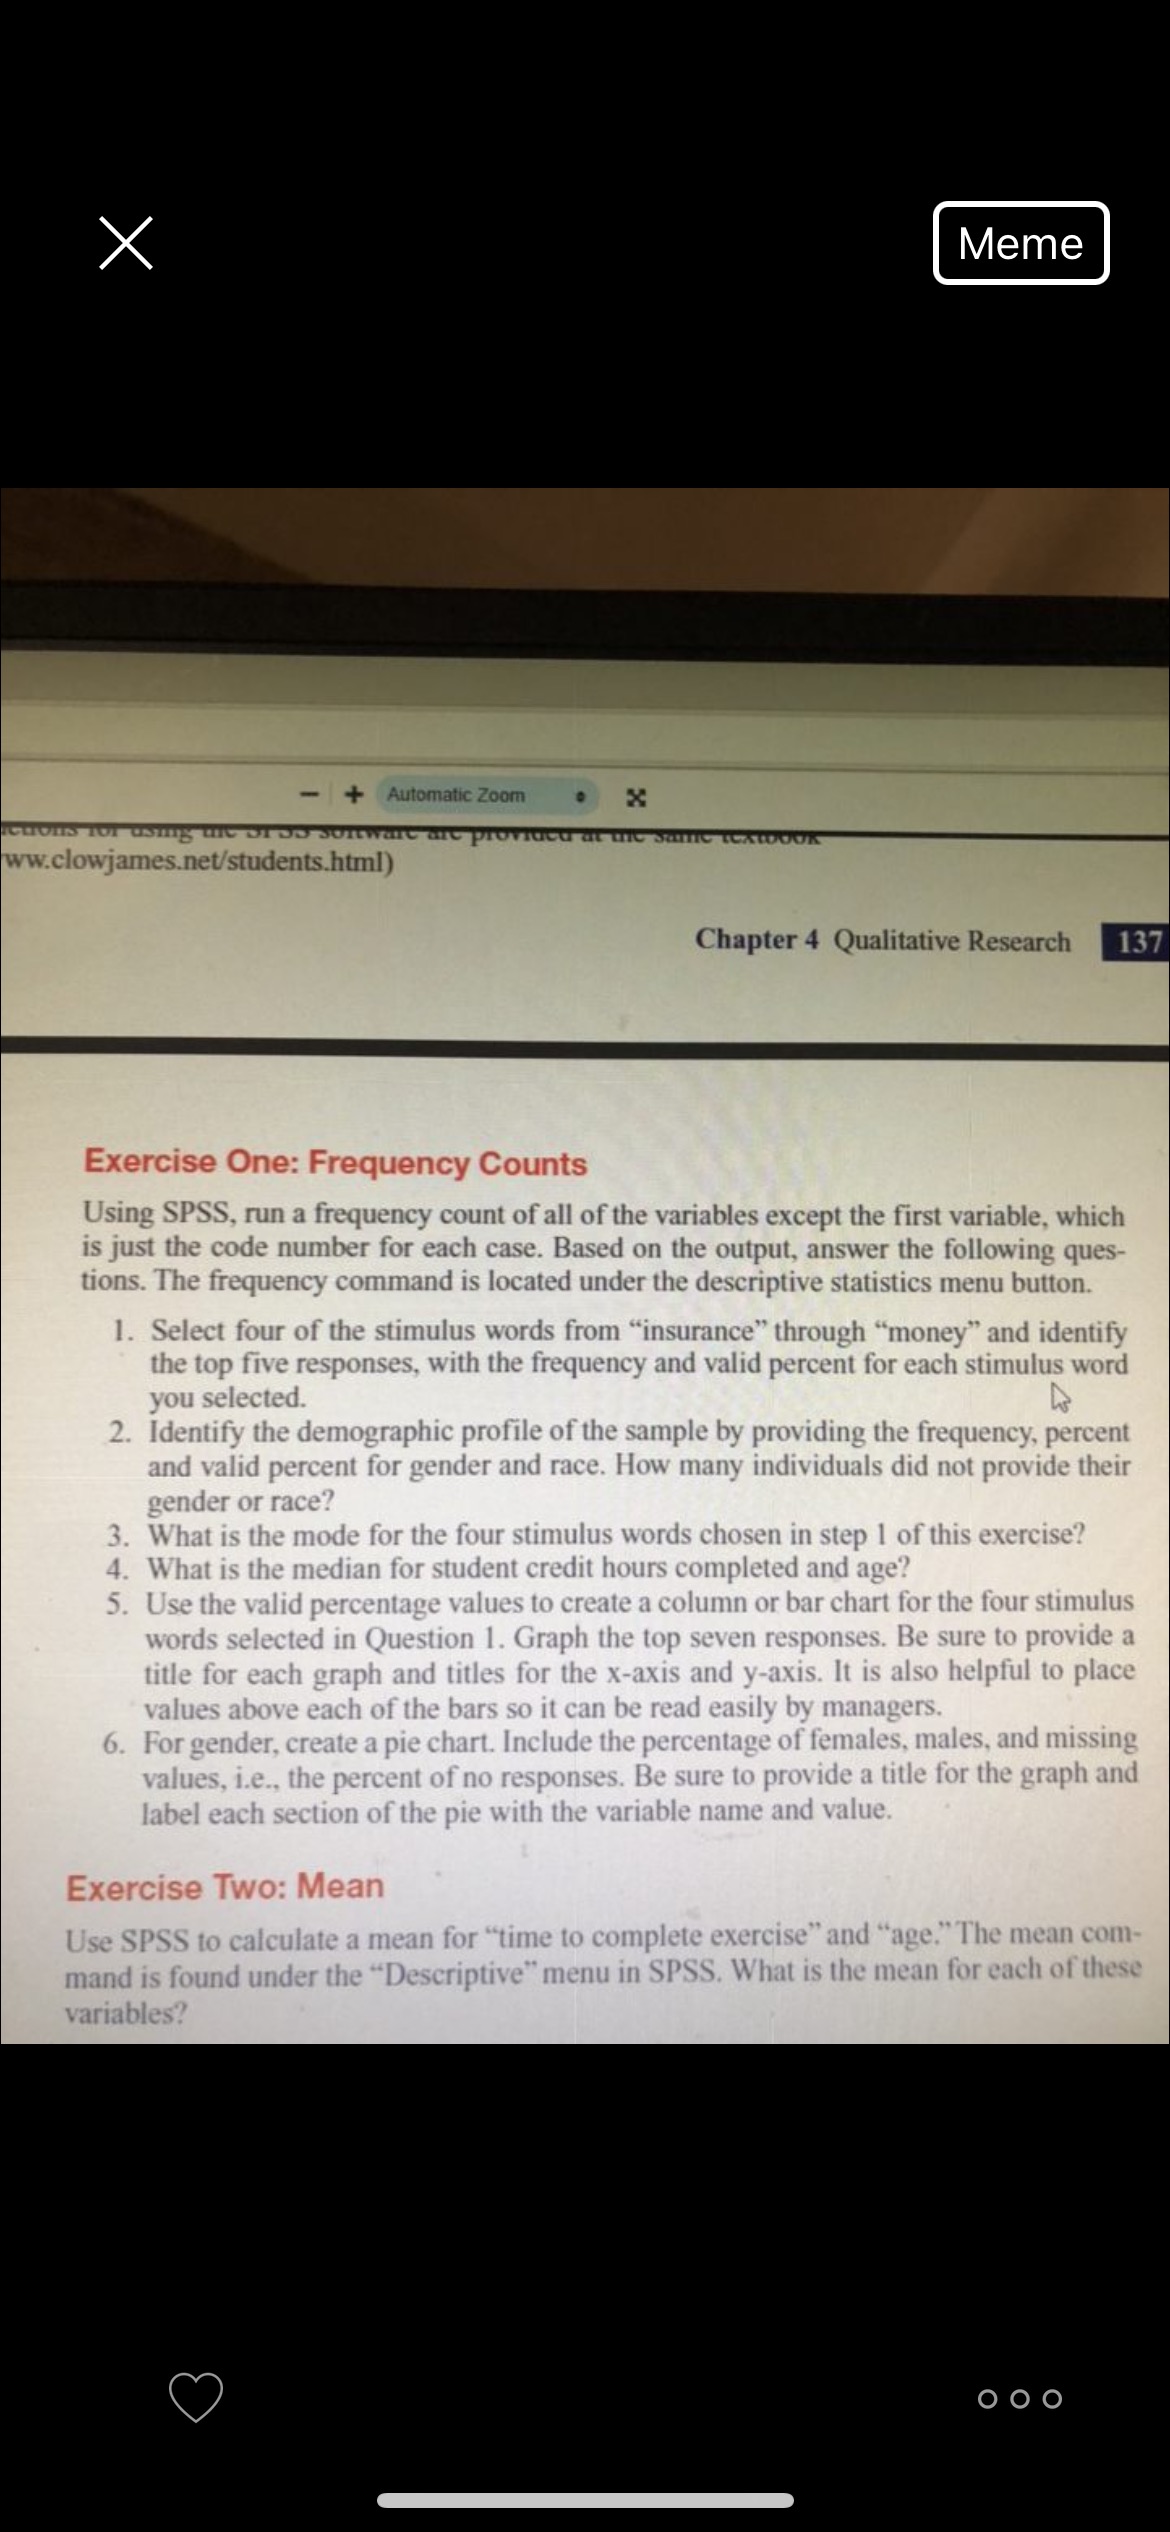
Chapter 4 Qualitative Research 137 Exercise One: Frequency Counts Using SPSS, run a frequency count of all of the variables except the first variable, which is just the code number for each case. Based on the output, answer the following ques. tions. The frequency command is located under the descriptive statistics menu button 1. Select four of the stimulus words from "insurance through money" and identify the top five responses, with the frequency and valid percent for each stimulus word you selected. 2. Identify the demographic profile of the sample by providing the frequency, percent and valid percent for gender and race. How many individuals did not provide their gender or race? 3. What is the mode for the four stimulus words chosen in step 1 of this exercise? 4. What is the median for student credit hours completed and age? 5. Use the valid percentage values to column or bar chart for the four stimulus words selected in Question 1. Graph the top seven responses. Be sure to provide a title for each graph and titles for the x-axis and y-axis. It is also helpful to place values above each of the bars so it can be read easily by managers 6. For gender, create a pie chart. Include the percentage of females, males, and missing values, i.e.. the percent of no responses. Be sure to provide a title for the graph and label each section of the pie with the variable name and value. Exercise Two: Mean Use SPSS to calculate a mean for "time to complete exercise" and "age." The mean com- mand is found under the "Descriptive"menu in SPSS. What is the mean for each of these variables?
Step by Step Solution
There are 3 Steps involved in it
Step: 1

Get Instant Access to Expert-Tailored Solutions
See step-by-step solutions with expert insights and AI powered tools for academic success
Step: 2

Step: 3
Ace Your Homework with AI
Get the answers you need in no time with our AI-driven, step-by-step assistance
Get Started
Retail Category Management
Authors: Deborah C. Fowler, Ben K. Goh
1st edition
135152089, 978-0135152089