Chapter 5 statistics
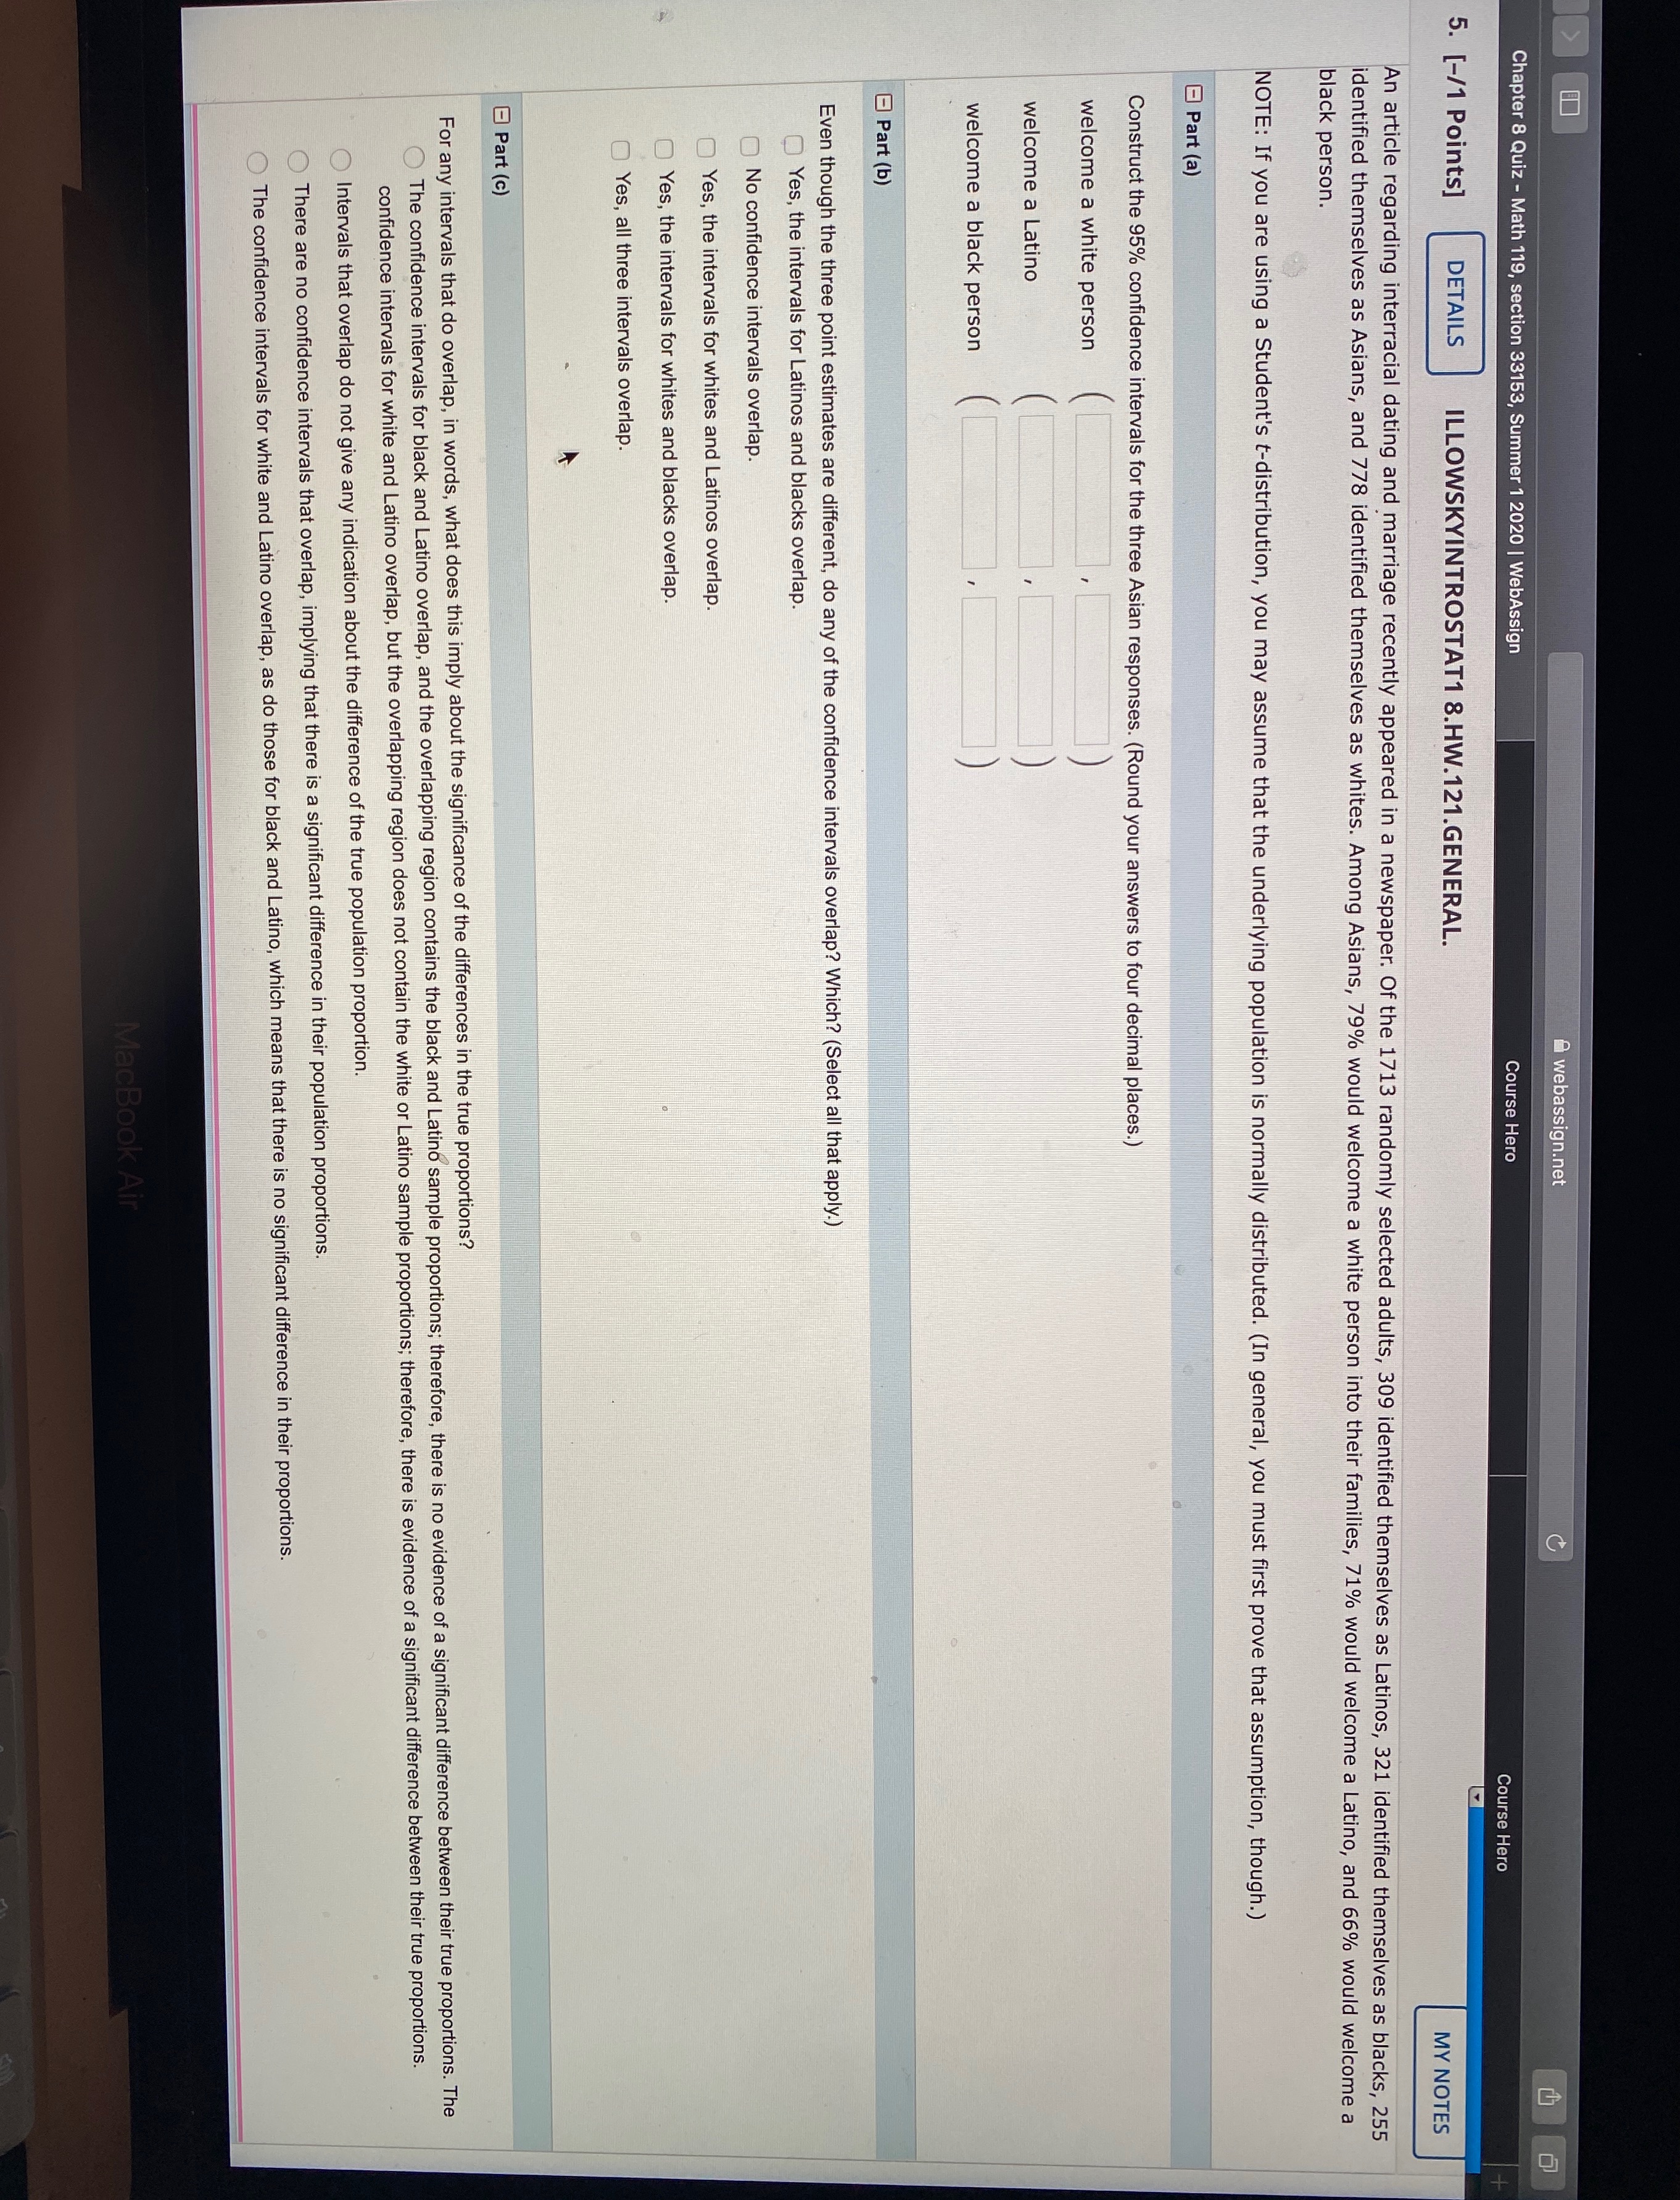
webassign.net Chapter 8 Quiz - Math 119, section 33153, Summer 1 2020 | WebAssign Course Hero Course Hero 5. [-/1 Points] DETAILS ILLOWSKYINTROSTAT1 8.HW.121.GENERAL. MY NOTES An article regarding interracial dating and marriage recently appeared in a newspaper. Of the 1713 randomly selected adults, 309 identified themselves as Latinos, 321 identified themselves as blacks, 255 black person. identified themselves as Asians, and 778 identified themselves as whites. Among Asians, 79% would welcome a white person into their families, 71% would welcome a Latino, and 66% would welcome a NOTE: If you are using a Student's t-distribution, you may assume that the underlying population is normally distributed. (In general, you must first prove that assumption, though.) Part (a) Construct the 95% confidence intervals for the three Asian responses. (Round your answers to four decimal places.) welcome a white person welcome a Latino welcome a black person Part (b) Even though the three point estimates are different, do any of the confidence intervals overlap? Which? (Select all that apply.) Yes, the intervals for Latinos and blacks overlap. No confidence intervals overlap . Yes, the intervals for whites and Latinos overlap . Yes , the intervals for whites and blacks overlap . Yes, all three intervals overlap. Part (c) For any intervals that do overlap, in words, what does this imply about the significance of the differences in the true proportions? The confidence intervals for black and Latino overlap, and the overlapping region contains the black and Latino sample proportions; therefore, there is no evidence of a significant difference between their true proportions. The confidence intervals for white and Latino overlap, but the overlapping region does not contain the white or Latino sample proportions; therefore, there is evidence of a significant difference between their true proportions. Intervals that overlap do not give any indication about the difference of the true population proportion. There are no confidence intervals that overlap, implying that there is a significant difference in their population proportions. The confidence intervals for white and Latino overlap, as do those for black and Latino, which means that there is no significant difference in their proportions. MacBook Air


