Answered step by step
Verified Expert Solution
Link Copied!

Question

1 Approved Answer

The table below presents results from a logistic regression analysis of breast cancer cases (N = 322) and unmatched controls (N = 1353) (Kelsey et

The table below presents results from a logistic regression analysis of breast

cancer cases (N = 322) and unmatched controls (N = 1353) (Kelsey et al., 1981)

from the same study as the ovarian cancer cases and controls (Hildreth et al., 1981) described in this chapter. The age distributions of cases and controls were similar, so that age does not appear as a variable in this table. The age range of cases and controls was 45-74 years.

  1. What do the odds ratio (and 95% confidence interval) of 1.87 (1.26-2.78) for the association of breast cancer with a history of breast cancer in a sister or mother mean?
  2. What do the odds ratio (and 95% confidence interval) of 1.34 (1.00-1.81) for the association of breast cancer with age at first birth mean?
  3. How much more likely to develop breast cancer is a woman whose menopause occurs at age 55 than a woman who is similar in other respects but whose menopause occurs at age 45? Calculate a confidence interval for your estimate.
  4. What does the statistically significant interaction of weight with time since last menstrual period mean?
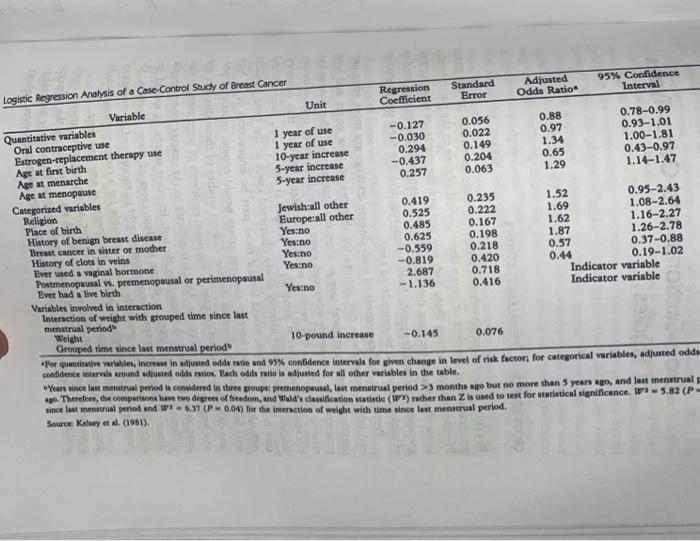
image text in transcribed
Logistic Regression Analysis of a Case-Control Study of Breast Cancer Regression Standard Adjusted 95% Confidence Variable Unit Coefficient Error Odds Ratios Interval Quantitative variables 0.056 0.88 0.78-0.99 Oral contraceptive use 1 year of use -0.127 I year of use -0.030 0.022 0.97 0.93-1,01 Estrogen-replacement therapy use Age at first birth 10-year increase 0.294 0.149 1.34 1.00-1.81 Age at menarche 5-year increase -0.437 0.204 0.65 0.43-0.97 5-year increase 0.257 0.063 1.29 1.14-1.47 Age at menopause Categorized variables Religion Jewish:all other 0.419 0.235 1.52 0.95-2.43 Place of birth Europe:all other 0.525 0.222 1.69 1.08-2.64 History of benign breast disease Yes:no 0.485 0.167 1.62 1.16-2.27 Breast cancer in sister or mother Yesno 0.625 0.198 1.87 1.26-2.78 History of clots in veins Yesno -0.559 0.218 0.57 0.37-0.88 Ever used a vaginal hormone Yesno -0.819 0.420 0.44 Postmenopausal vi. premenopausal or perimenopausal 0.19-1.02 Ever had a live birth 2.687 0.718 Indicator variable Yes!no -1.136 0.416 Variables involved in interaction Indicator variable Interaction of weight with grouped time since last menstrual periods Weight Grouped time since last menstrual period" 10-pound increase -0.145 0.076 For quanthadon variables, increase in adjusted odds ratio and 93%% confidence intervals for given change in level of risk factor, for categorical variables, adjusted odd enciadence intervals ground adjusted odds ration. Each odds ratio in adjusted for all other variables in the table. " Years since last menurual period is considered in three groups premenopausal, lait menstrual period 2:3 months ago but no more than 3 years ago, and last menstrual ago. Therefore, the comparisons have two degrees of freedom, and Wald's classification statistic ( WI) rather than Z is used to test for statistical significance. W's = 3,82 (P since last menstrual period and IF = 6.37 (P - 0.04) for the imarection of weight with time since last menstrual period. Source: Kelsey et d. (1981)

Step by Step Solution

There are 3 Steps involved in it

Step: 1

blur-text-image

Get Instant Access to Expert-Tailored Solutions

See step-by-step solutions with expert insights and AI powered tools for academic success

Step: 2

blur-text-image

Step: 3

blur-text-image

Ace Your Homework with AI

Get the answers you need in no time with our AI-driven, step-by-step assistance

Get Started

Recommended Textbook for

Making Hard Decisions with decision tools

Authors: Robert Clemen, Terence Reilly

3rd edition

538797576, 978-0538797573

More Books

Students also viewed these Mathematics questions