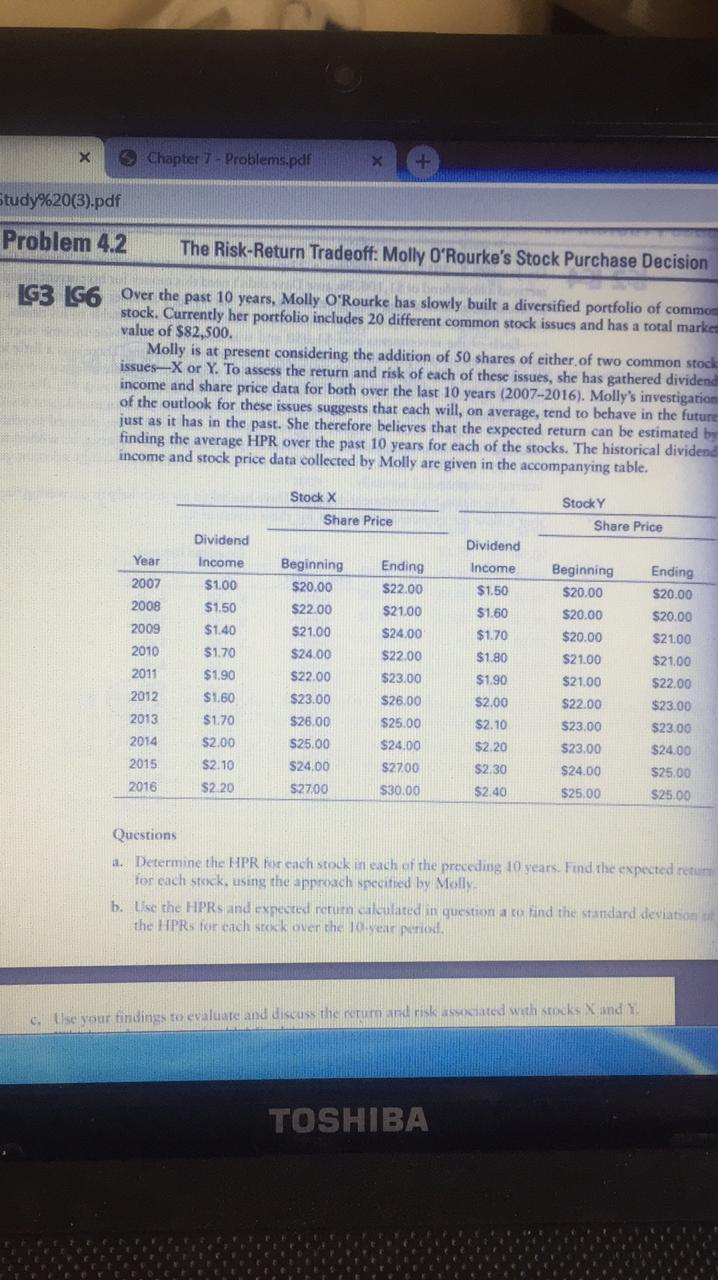
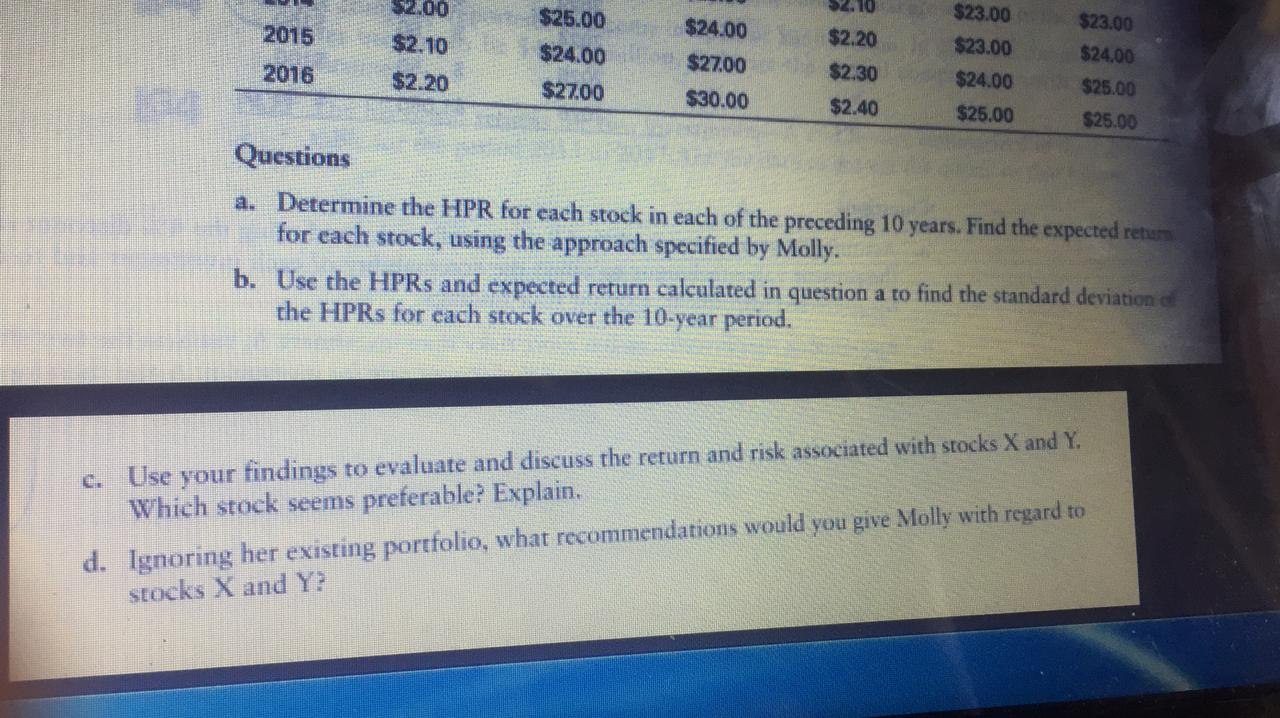
Chapter 7 Problems.pdf Study%20(3).pdf Problem 4.2 The Risk-Return Tradeoff: Molly O'Rourke's Stock Purchase Decision IG3 LG6 Over the past 10 years, Molly O'Rourke has slowly built a diversified portfolio of common stock. Currently her portfolio includes 20 different common stock issues and has a total marker value of $82,500. Molly is at present considering the addition of 50 shares of either of two common stock issues-X or Y. To assess the return and risk of each of these issues, she has gathered dividend income and share price data for both over the last 10 years (2007-2016). Molly's investigation of the outlook for these issues suggests that each will, on average, tend to behave in the future just as it has in the past. She therefore believes that the expected return can be estimated by finding the average HPR over the past 10 years for each of the stocks. The historical dividend income and stock price data collected by Molly are given in the accompanying table. Stock X Share Price Stock Y Share Price Year 2007 2008 Dividend Income $1.00 $1.50 $1.40 $1.70 Beginning $20.00 $22.00 $21.00 Ending $22.00 $21.00 S24.00 2009 2010 Dividend Income $1.50 $1.60 $1.70 $1.80 $1.90 $2.00 $2.10 $2.20 $2.30 $24.00 $22.00 $23.00 $26.00 S25.00 S24.00 $27.00 Beginning $20.00 $20.00 $20.00 $21.00 $21.00 $22.00 $23.00 $23.00 $22.00 $23.00 $26.00 $25.00 $24.00 2011 2012 2013 Ending $20.00 $20.00 $21.00 $21.00 $22.00 $23.00 $23.00 $24.00 $1.90 $1.60 $1.70 $2.00 $2.10 S2.20 2014 2015 2016 $2700 $30.00 $24.00 $25,00 $25.00 525.00 $2.40 Questions a. Determine the HPR for each stock in each of the preceding 10 years. Find the expected retum for each stock, using the approach specified by Molly b. Use the HPRS and expected return calculated in question a rotind the standard deviation the HPRs for each stack over the lower period, c. Use your findings to evaluate and discuss the return and risk associated with stocks X and Y TOSHIBA 2015 $12.00 $2.10 $2.20 $25.00 $24.00 02.10 $2.20 $23.00 $24.00 2016 $24.00 $27.00 $30.00 $23.00 $23.00 $24.00 $25.00 $2.30 $2.40 $27.00 $25.00 $25.00 Questions a. Determine the HPR for each stock in each of the preceding 10 years. Find the expected return. for each stock, using the approach specified by Molly. b. Use the HPRs and expected return calculated in question a to find the standard deviation the HPRs for each stock over the 10-year period. el Use your findings to evaluate and discuss the return and risk associated with stocks X and Y. Which stock seems preferable? Explain. d. Ignoring her existing portfolio, what recommendations would you give Molly with regard to stocks X and Y: Chapter 7 Problems.pdf Study%20(3).pdf Problem 4.2 The Risk-Return Tradeoff: Molly O'Rourke's Stock Purchase Decision IG3 LG6 Over the past 10 years, Molly O'Rourke has slowly built a diversified portfolio of common stock. Currently her portfolio includes 20 different common stock issues and has a total marker value of $82,500. Molly is at present considering the addition of 50 shares of either of two common stock issues-X or Y. To assess the return and risk of each of these issues, she has gathered dividend income and share price data for both over the last 10 years (2007-2016). Molly's investigation of the outlook for these issues suggests that each will, on average, tend to behave in the future just as it has in the past. She therefore believes that the expected return can be estimated by finding the average HPR over the past 10 years for each of the stocks. The historical dividend income and stock price data collected by Molly are given in the accompanying table. Stock X Share Price Stock Y Share Price Year 2007 2008 Dividend Income $1.00 $1.50 $1.40 $1.70 Beginning $20.00 $22.00 $21.00 Ending $22.00 $21.00 S24.00 2009 2010 Dividend Income $1.50 $1.60 $1.70 $1.80 $1.90 $2.00 $2.10 $2.20 $2.30 $24.00 $22.00 $23.00 $26.00 S25.00 S24.00 $27.00 Beginning $20.00 $20.00 $20.00 $21.00 $21.00 $22.00 $23.00 $23.00 $22.00 $23.00 $26.00 $25.00 $24.00 2011 2012 2013 Ending $20.00 $20.00 $21.00 $21.00 $22.00 $23.00 $23.00 $24.00 $1.90 $1.60 $1.70 $2.00 $2.10 S2.20 2014 2015 2016 $2700 $30.00 $24.00 $25,00 $25.00 525.00 $2.40 Questions a. Determine the HPR for each stock in each of the preceding 10 years. Find the expected retum for each stock, using the approach specified by Molly b. Use the HPRS and expected return calculated in question a rotind the standard deviation the HPRs for each stack over the lower period, c. Use your findings to evaluate and discuss the return and risk associated with stocks X and Y TOSHIBA 2015 $12.00 $2.10 $2.20 $25.00 $24.00 02.10 $2.20 $23.00 $24.00 2016 $24.00 $27.00 $30.00 $23.00 $23.00 $24.00 $25.00 $2.30 $2.40 $27.00 $25.00 $25.00 Questions a. Determine the HPR for each stock in each of the preceding 10 years. Find the expected return. for each stock, using the approach specified by Molly. b. Use the HPRs and expected return calculated in question a to find the standard deviation the HPRs for each stock over the 10-year period. el Use your findings to evaluate and discuss the return and risk associated with stocks X and Y. Which stock seems preferable? Explain. d. Ignoring her existing portfolio, what recommendations would you give Molly with regard to stocks X and Y