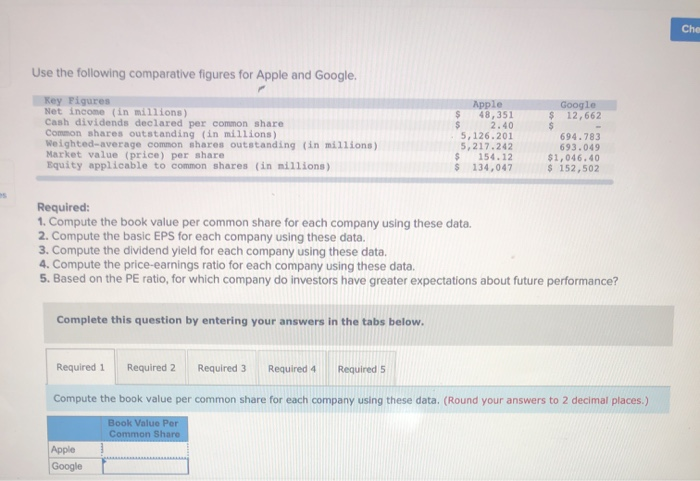
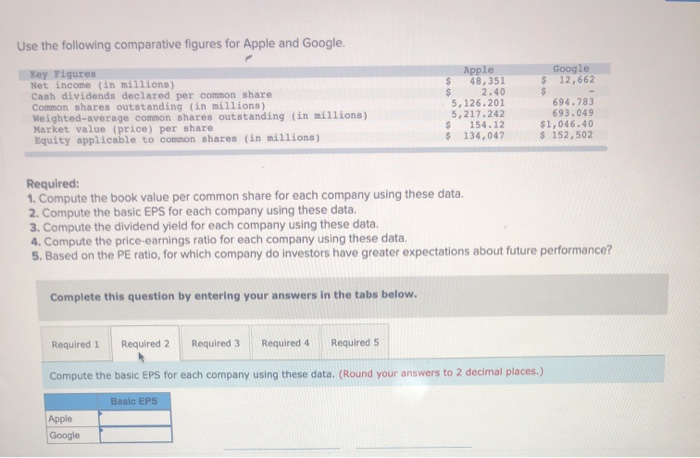
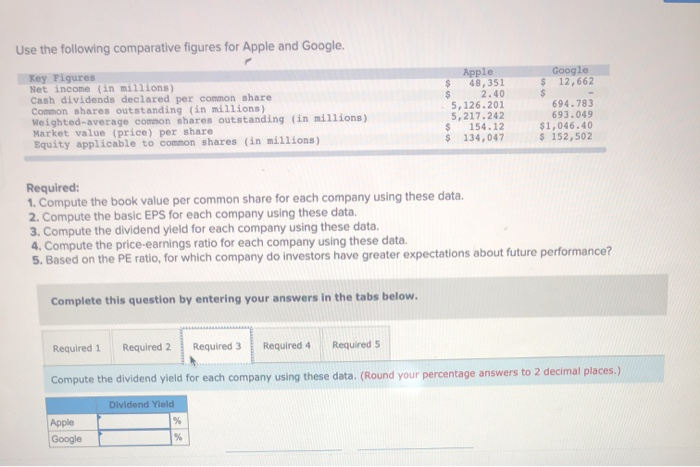
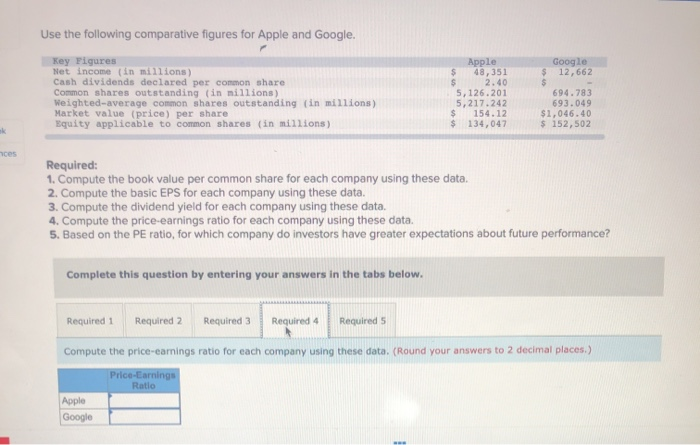
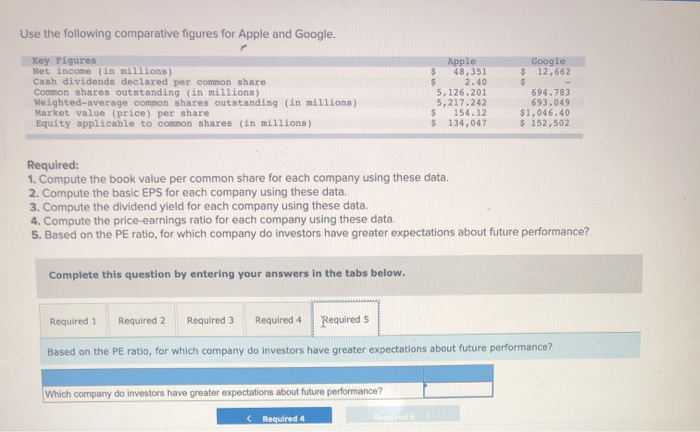
Che Use the following comparative figures for Apple and Google. Google 12.662 $ Key Figures Net income (in millions) Cash dividends declared per common share Common shares outstanding in millions) Weighted average common shares outstanding (in millions) Market value (price) per share Equity applicable to common shares (in millions) Apple $ 48,351 $ 2.40 5,126.201 5,217.242 $ 154.12 $ 134,047 694.783 693.049 $1.046.40 $152,502 Required: 1. Compute the book value per common share for each company using these data. 2. Compute the basic EPS for each company using these data. 3. Compute the dividend yield for each company using these data. 4. Compute the price-earnings ratio for each company using these data, 5. Based on the PE ratio, for which company do investors have greater expectations about future performance? Complete this question by entering your answers in the tabs below. Required 1 Required 2 Required 3 Required 4 Required 5 Compute the book value per common share for each company using these data. (Round your answers to 2 decimal places.) Book Value Per Common Share Apple Google Use the following comparative figures for Apple and Google. Google 12,662 $ Key Figures Net income (in millions) Cash dividends declared per common share Common shares outstanding (in millions) Weighted average common shares outstanding in millions) Market value (price) per share Equity applicable to common shares (in millions) Apple $ 48,351 $ 2.40 5,126.201 5,217.242 $ 154.12 $ 134,047 694.783 693.049 $1,046.40 $ 152,502 Required: 1. Compute the book value per common share for each company using these data, 2. Compute the basic EPS for each company using these data. 3. Compute the dividend yield for each company using these data. 4. Compute the price-earnings ratio for each company using these data. 5. Based on the PE ratio, for which company do investors have greater expectations about future performance? Complete this question by entering your answers in the tabs below. Required: Required 2 Required 3 Required 4 Required 5 Compute the basic EPS for each company using these data. (Round your answers to 2 decimal places.) Basic EPS Apple Google Use the following comparative figures for Apple and Google. $ Google 12,662 Key Figures Net income (in millions) Cash dividends declared per common share Common shares outstanding (in millions) Weighted average common shares outstanding (in millions) Market value (price) per share Equity applicable to common shares (in millions) Apple $ 48.351 $ 2.40 5,126.201 5,217.242 $ 154.12 $ 134,047 694.783 693.049 $1,046.40 $ 152,502 Required: 1. Compute the book value per common share for each company using these data. 2. Compute the basic EPS for each company using these data. 3. Compute the dividend yield for each company using these data. 4. Compute the price-earnings ratio for each company using these data. 5. Based on the PE ratio, for which company do investors have greater expectations about future performance? Complete this question by entering your answers in the tabs below. Required 1 Required 2 Required 3 Required 4 Required 5 Compute the dividend yield for each company using these data. (Round your percentage answers to 2 decimal places.) Dividend Yield Apple Google Use the following comparative figures for Apple and Google. Google 12,662 $ Key Figures Net income in millions) Cash dividends declared per common share Common shares outstanding (in millions) Weighted average common shares outstanding (in millions) Market value (price) per share Equity applicable to common shares (in millions) Apple $ 48,351 2.40 5,126.201 5,217.242 $ 154.12 $ 134,047 694.783 693.049 $1,046.40 $ 152,502 Required: 1. Compute the book value per common share for each company using these data. 2. Compute the basic EPS for each company using these data. 3. Compute the dividend yield for each company using these data 4. Compute the price-earnings ratio for each company using these data. 5. Based on the PE ratio, for which company do investors have greater expectations about future performance? Complete this question by entering your answers in the tabs below. Required 1 Required 2 Required 3 Required 4 Required 5 Compute the price-camnings ratio for each company using these data. (Round your answers to 2 decimal places.) Price Earnings Ratio Apple Google Use the following comparative figures for Apple and Google. $ Google 12,662 Key Figures Net income in millions) Cash dividends declared per common share Common shares outstanding (in millions) Weighted-average common shares outstanding (in millions) Market value (price) per share Equity applicable to common shares (in millions) Apple $ 48,351 2.40 5.126.201 5.217.242 $ 154.12 $ 134,047 694.783 693.049 $1,046.40 $ 152,502 Required: 1. Compute the book value per common share for each company using these data, 2. Compute the basic EPS for each company using these data. 3. Compute the dividend yield for each company using these data. 4. Compute the price-earnings ratio for each company using these data 5. Based on the PE ratio, for which company do investors have greater expectations about future performance? Complete this question by entering your answers in the tabs below. Required 1 Required 2 Required 3 Required 4 Required 5 Based on the PE ratio, for which company do investors have greater expectations about future performance? Which company do investors have greater expectations about future performance? ( Required 4