

Answered step by step
Verified Expert Solution
Question
1 Approved Answer
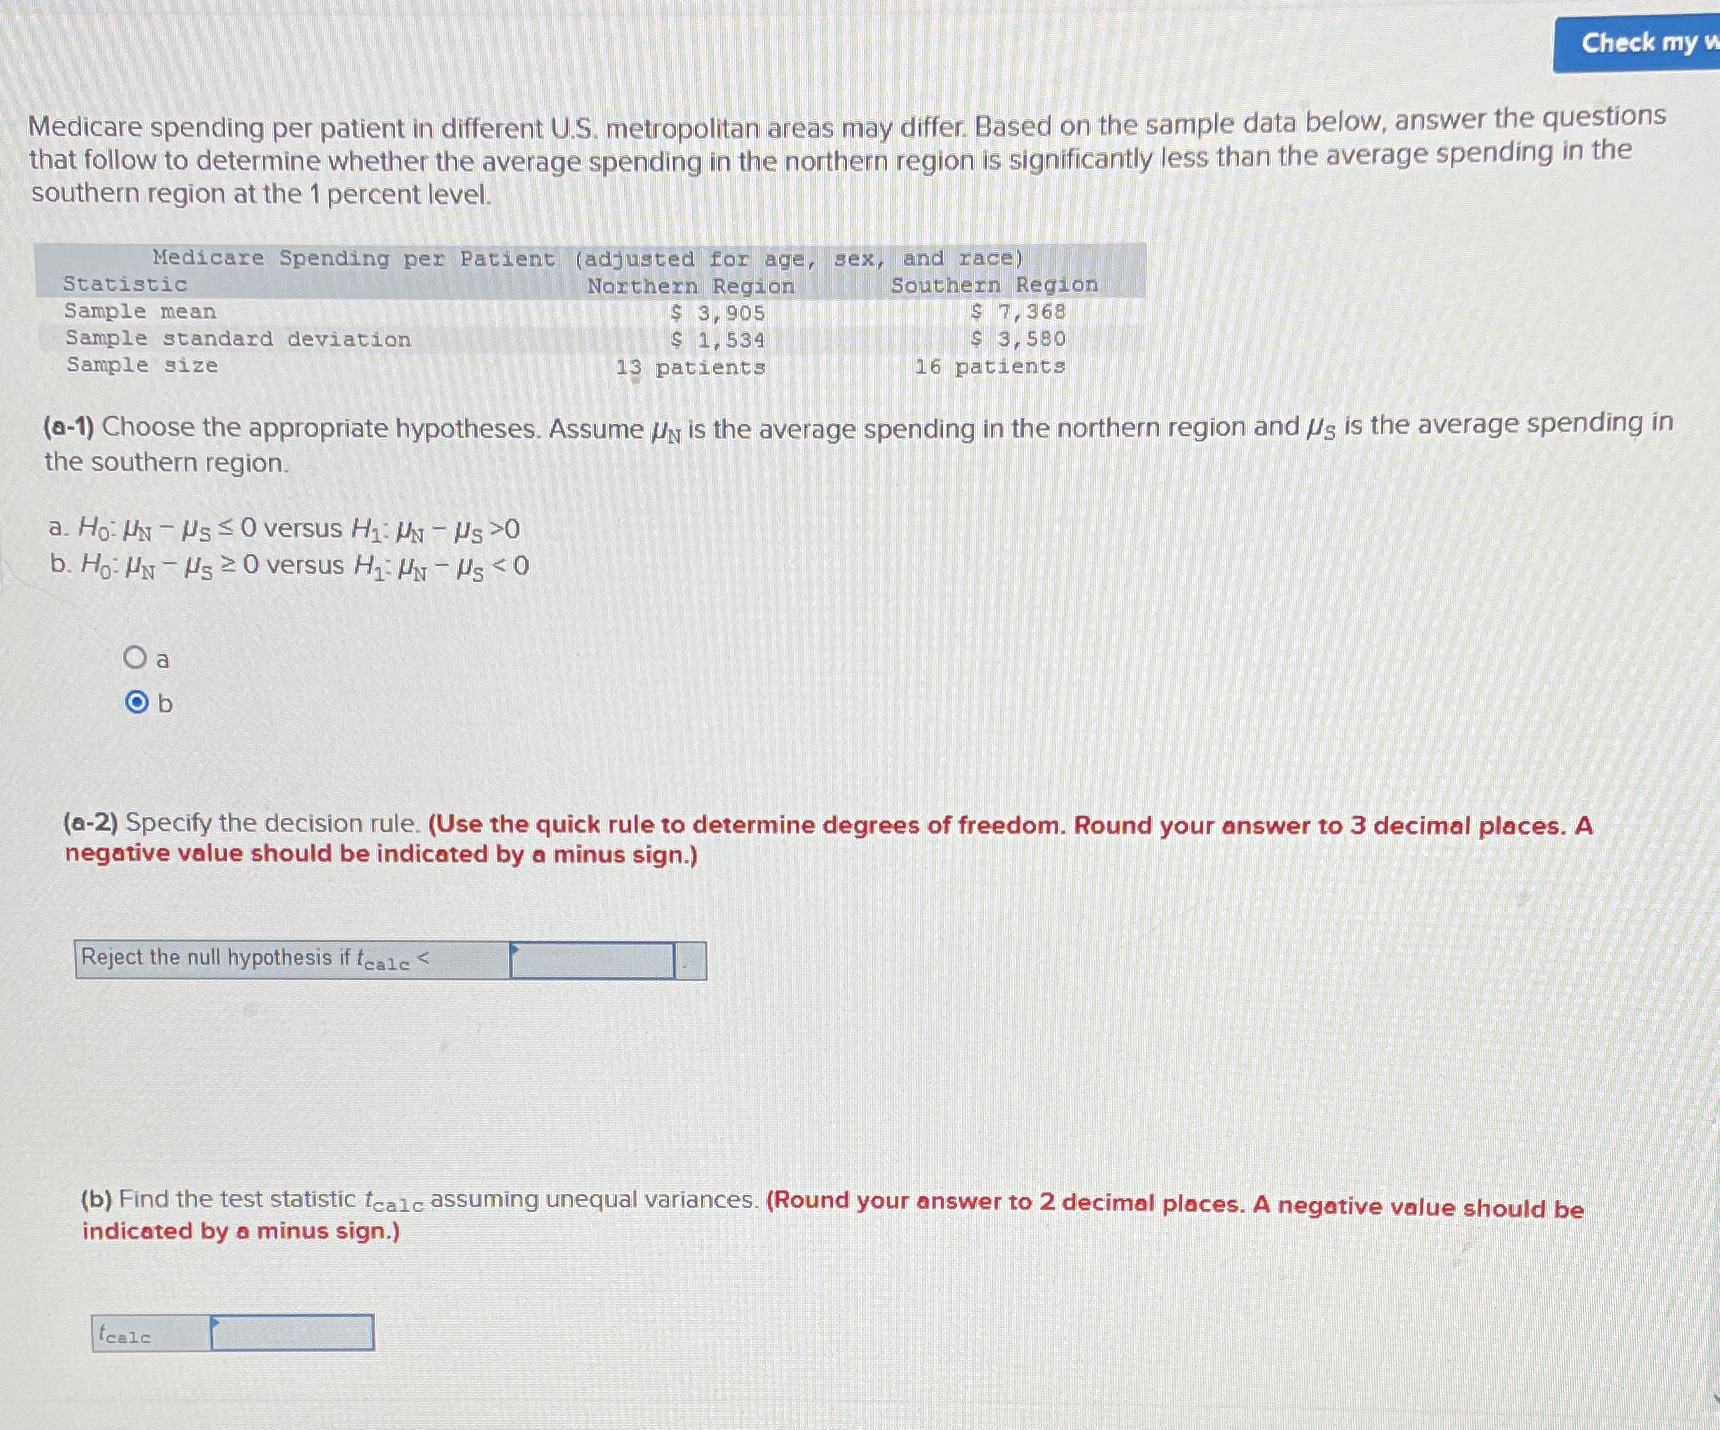
Check my Medicare spending per patient in different U.S. metropolitan areas may differ. Based on the sample data below, answer the questions that follow to
Step by Step Solution
There are 3 Steps involved in it
Step: 1

Get Instant Access to Expert-Tailored Solutions
See step-by-step solutions with expert insights and AI powered tools for academic success
Step: 2

Step: 3
Ace Your Homework with AI
Get the answers you need in no time with our AI-driven, step-by-step assistance
Get Started
Finite Math And Applied Calculus
Authors: Stefan Waner, Steven Costenoble
2nd Edition
0534366309, 9780534366308