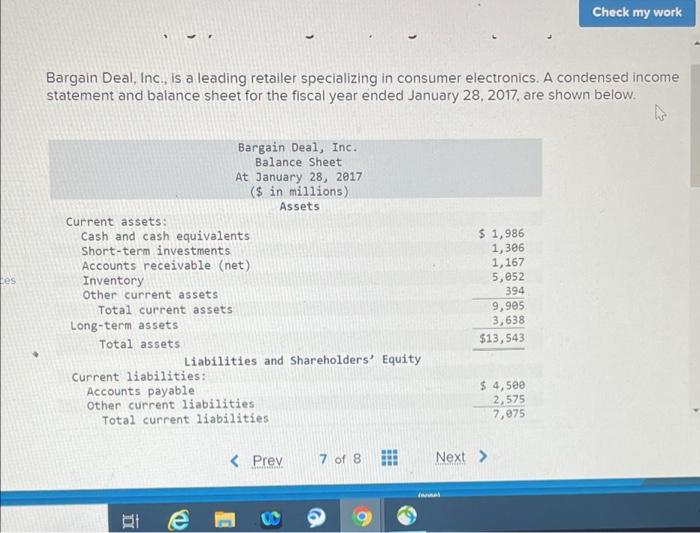
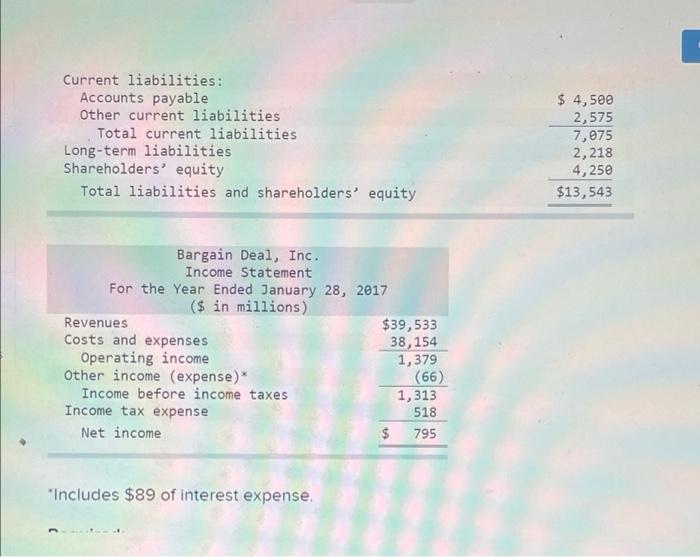
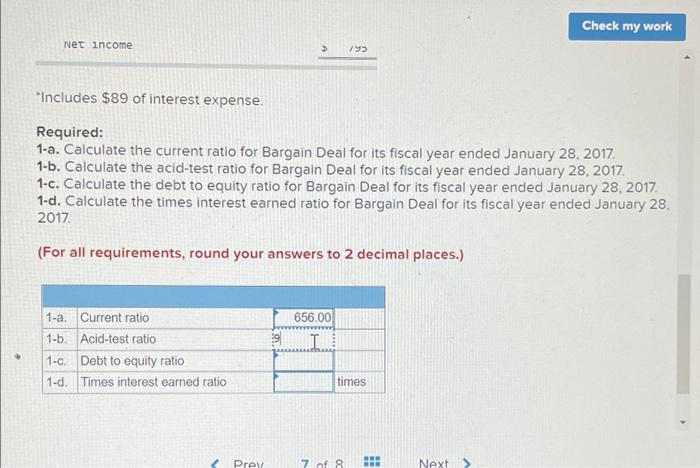
Check my work Bargain Deal, Inc., is a leading retailer specializing in consumer electronics. A condensed income statement and balance sheet for the fiscal year ended January 28, 2017, are shown below. IN Les Bargain Deal, Inc. Balance Sheet At January 28, 2017 ($ in millions) Assets Current assets: Cash and cash equivalents Short-term investments Accounts receivable (net) Inventory Other current assets Total current assets Long-term assets Total assets Liabilities and Shareholders' Equity Current liabilities: Accounts payable Other current liabilities Total current liabilities $ 1,986 1,306 1,167 5,052 394 9,905 3,638 $13,543 $ 4,500 2,575 7,075 BE Current liabilities: Accounts payable Other current liabilities Total current liabilities Long-term liabilities Shareholders' equity Total liabilities and shareholders' equity $ 4,500 2,575 7,075 2,218 4,250 $13,543 Bargain Deal, Inc. Income Statement For the Year Ended January 28, 2017 ($ in millions) Revenues $39,533 Costs and expenses 38,154 Operating income 1,379 Other income (expense)* (66) Income before income taxes 1,313 Income tax expense 518 Net income $ 795 "Includes $89 of interest expense. Check my work Net income > *Includes $89 of interest expense. Required: 1-a. Calculate the current ratio for Bargain Deal for its fiscal year ended January 28, 2017 1-b. Calculate the acid-test ratio for Bargain Deal for its fiscal year ended January 28, 2017 1-c. Calculate the debt to equity ratio for Bargain Deal for its fiscal year ended January 28, 2017 1-d. Calculate the times interest earned ratio for Bargain Deal for its fiscal year ended January 28, 2017 (For all requirements, round your answers to 2 decimal places.) 656.00 II 19 1-a. Current ratio 1-b. Acid-test ratio 1-C. Debt to equity ratio 1-d Times interest earned ratio times Prey 7 of 8 1 Next >