

Answered step by step
Verified Expert Solution
Question
1 Approved Answer
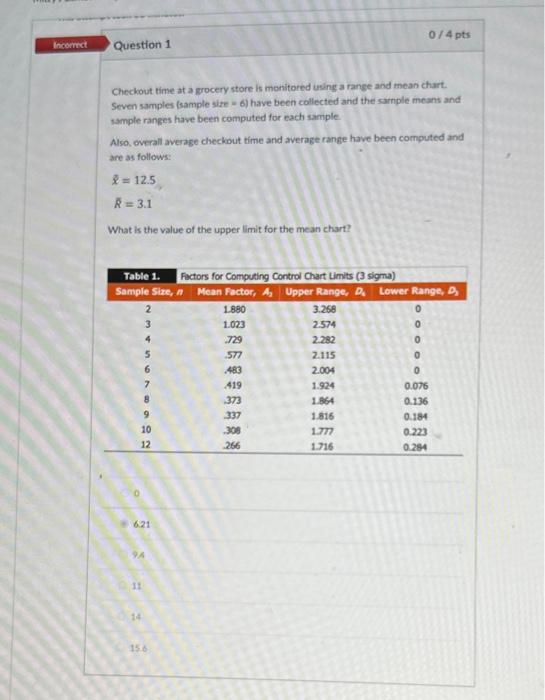
Checkout time at a grocery store is monitored using a range and mean chart. Seven samples fsample site =6 ) have been collected and the
Step by Step Solution
There are 3 Steps involved in it
Step: 1

Get Instant Access to Expert-Tailored Solutions
See step-by-step solutions with expert insights and AI powered tools for academic success
Step: 2

Step: 3
Ace Your Homework with AI
Get the answers you need in no time with our AI-driven, step-by-step assistance
Get Started
Unlock Financial Success With Self Storage Wealth Strategies
Authors: Ethan D. Costa
1st Edition
979-8866108695