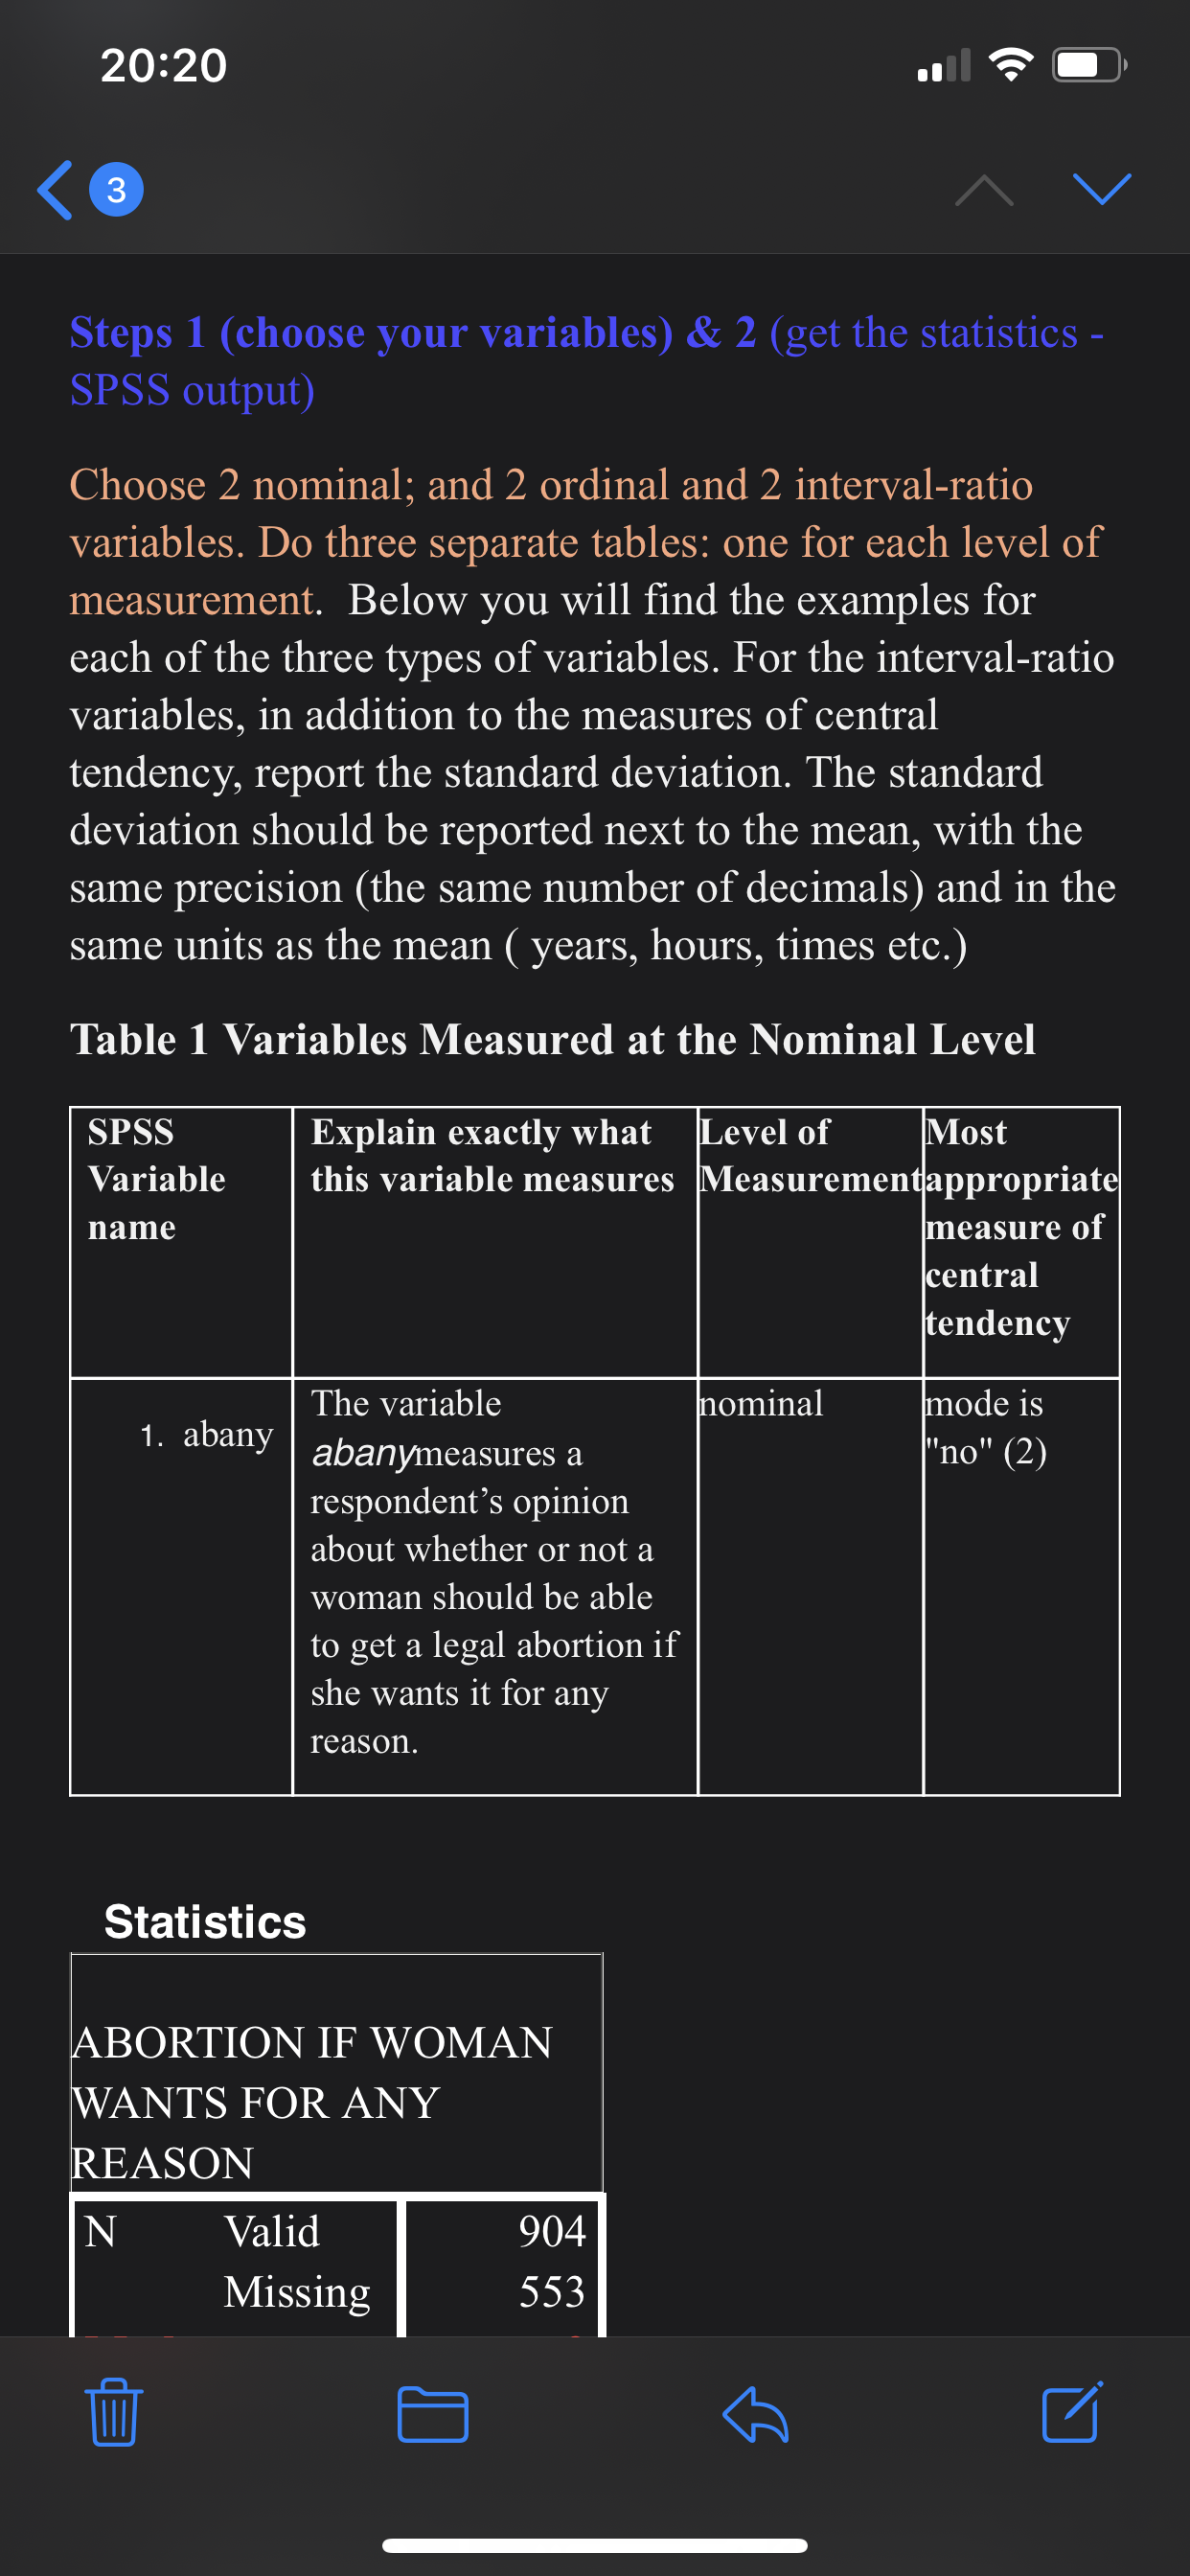
Choose 2 nominal; and 2 ordinal and 2 interval-ratio variables. Do three separate tables: one for each level of measurement.Below you will find the examples for each of the three types of variables. For the interval-ratio variables, in addition to the measures of central tendency, report the standard deviation. The standard deviation should be reported next to the mean, with the same precision (the same number of decimals) and in the same units as the mean ( years, hours, times etc.)
Table 1 Variables Measured at the Nominal Level
SPSS Variable name
Explain exactly what this variable measures
Level of Measurement
Most appropriate measure of central tendency
- abany
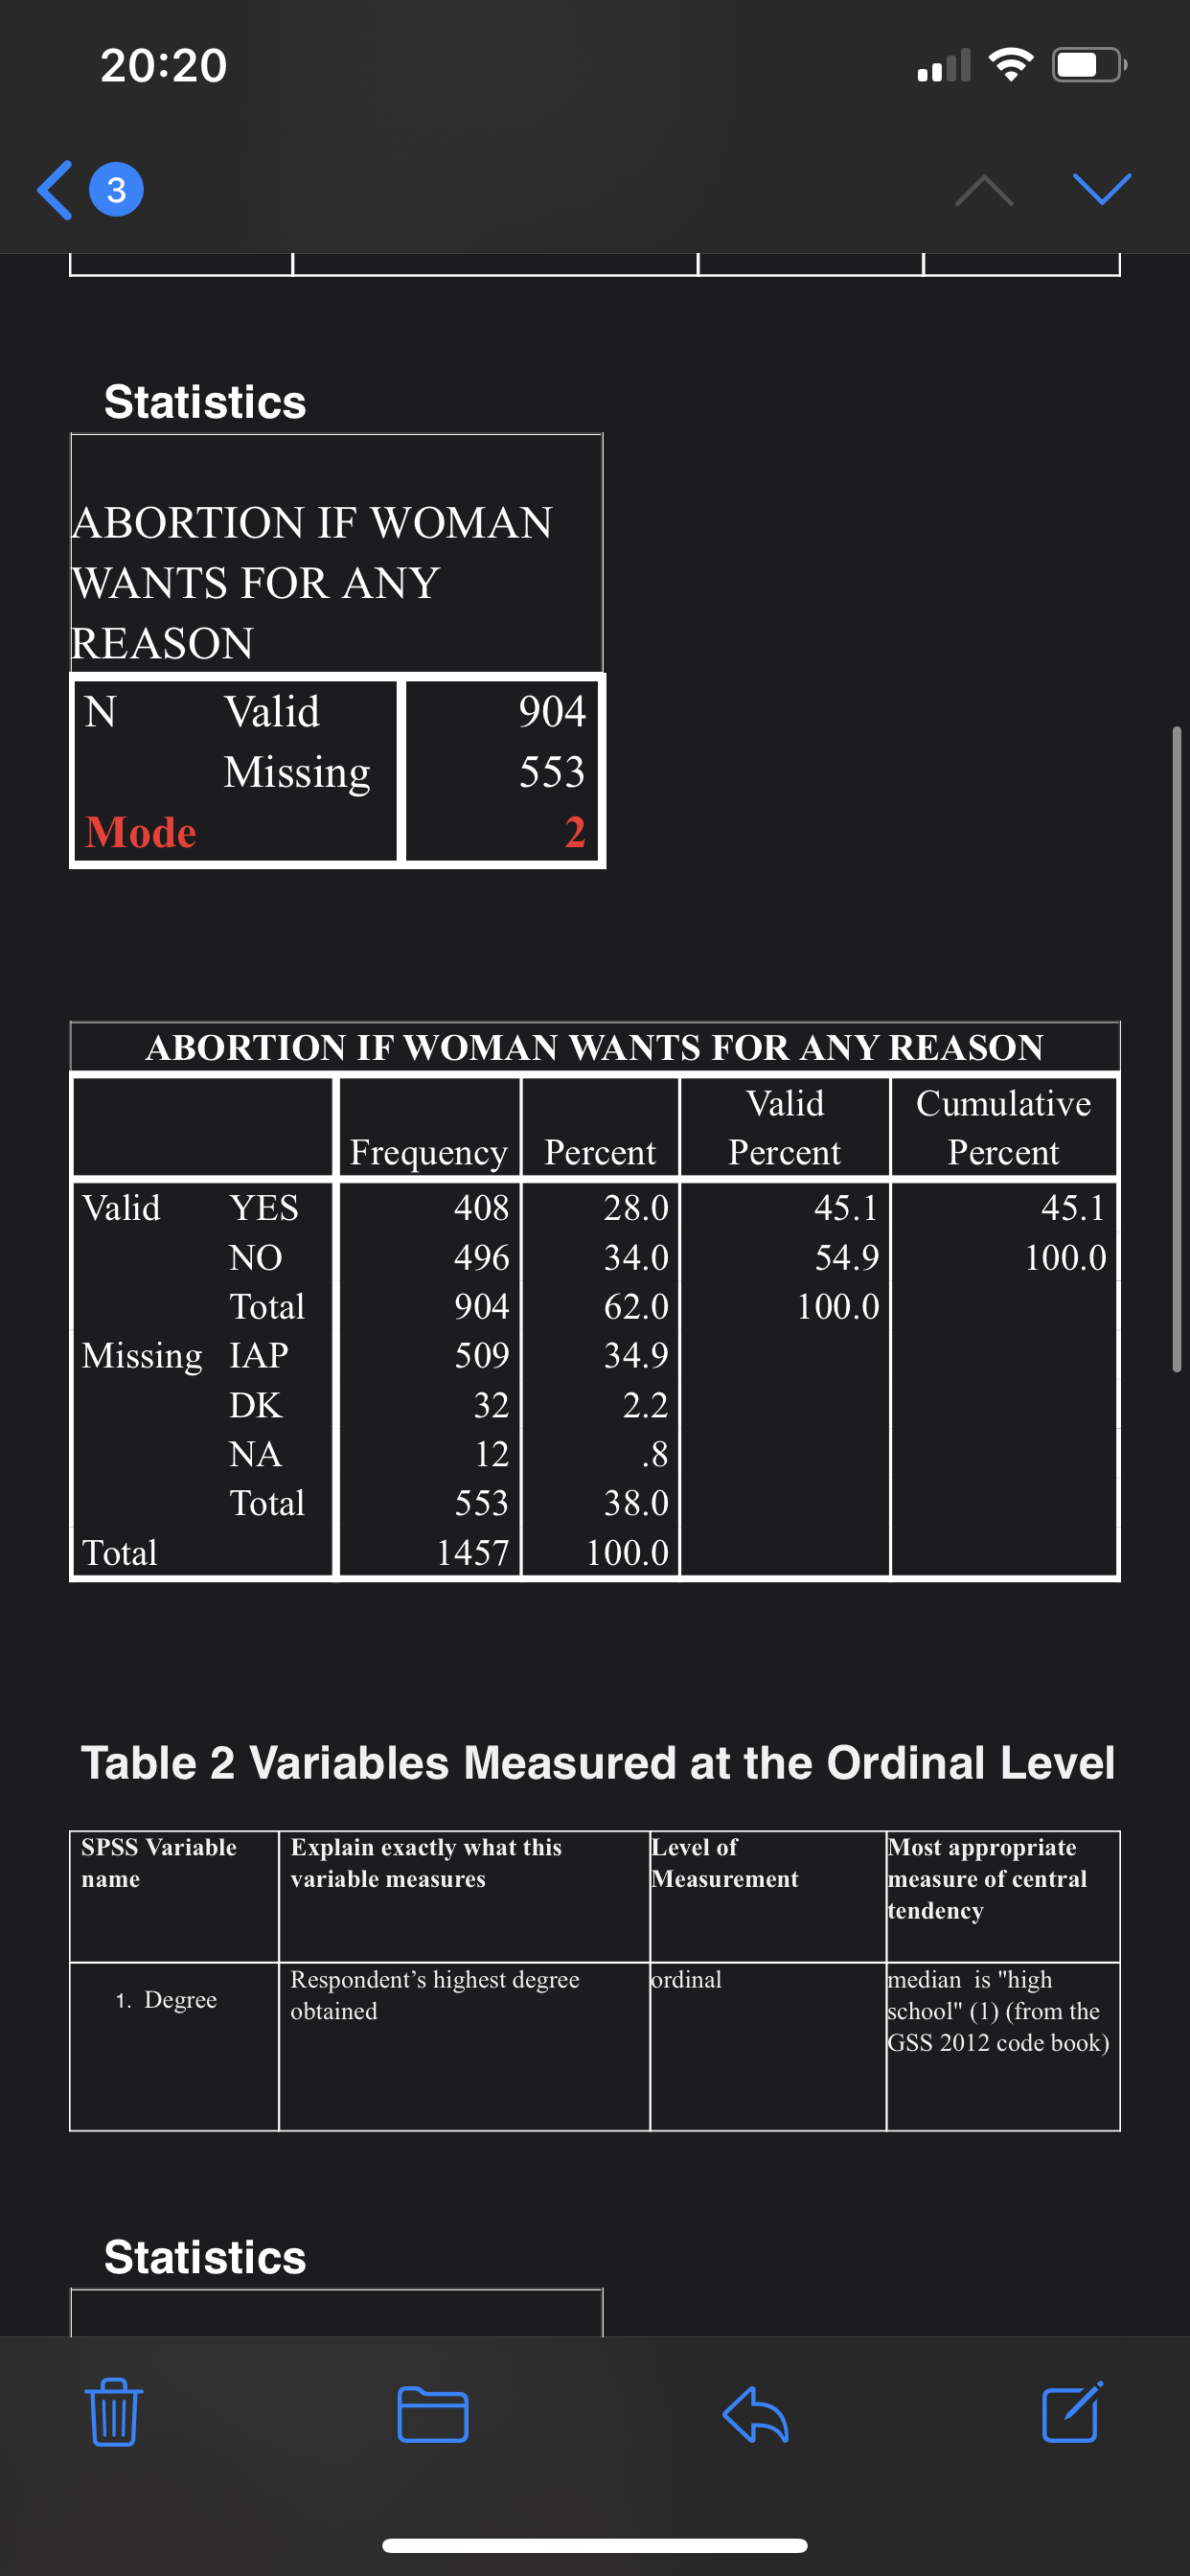
The variableabanymeasures a respondent's opinion about whether or not a woman should be able to get a legal abortion if she wants it for any reason.
nominal
mode is "no" (2)
Statistics
ABORTION IF WOMAN WANTS FOR ANY REASON
N
Valid
904
Missing
553
Mode
2
ABORTION IF WOMAN WANTS FOR ANY REASON
Frequency
Percent
Valid Percent
Cumulative Percent
Valid
YES
408
28.0
45.1
45.1
NO
496
34.0
54.9
100.0
Total
904
62.0
100.0
Missing
IAP
509
34.9
DK
32
2.2
NA
12
.8
Total
553
38.0
Total
1457
100.0
Table 2 Variables Measured at the Ordinal Level
SPSS Variable name
Explain exactly what this variable measures
Level of Measurement
Most appropriate measure of central tendency
- Degree
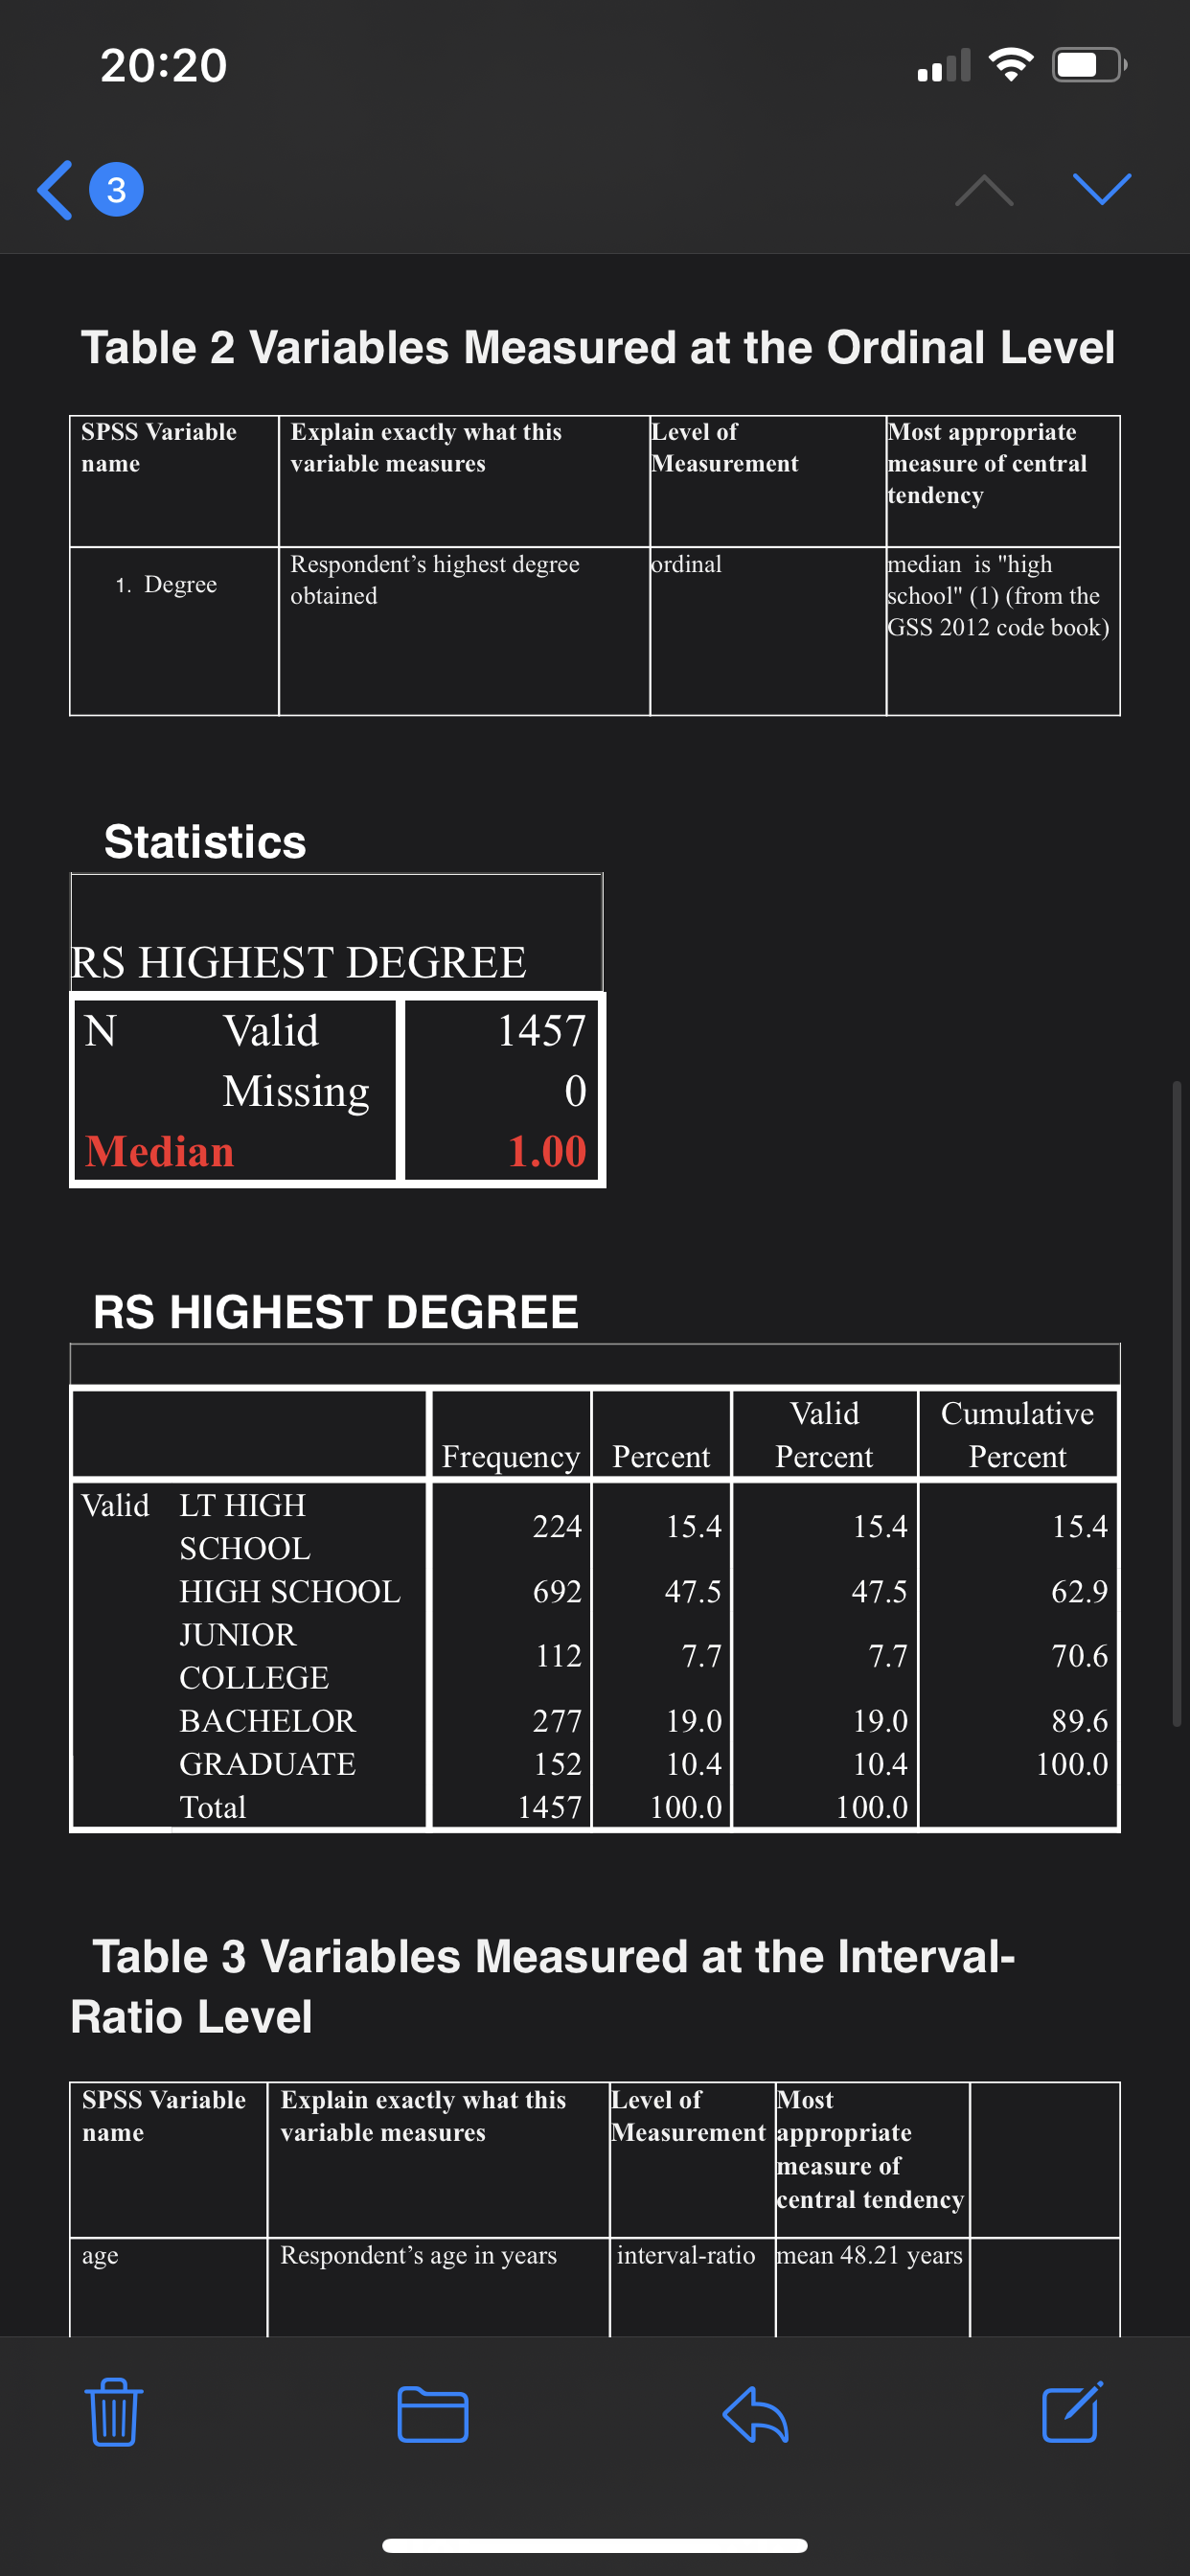
Respondent's highest degree obtained
ordinal
medianis "high school" (1) (from the GSS 2012 code book)
Statistics
RS HIGHEST DEGREE
N
Valid
1457
Missing
0
Median
1.00
RS HIGHEST DEGREE
Frequency
Percent
Valid Percent
Cumulative Percent
Valid
LT HIGH SCHOOL
224
15.4
15.4
15.4
HIGH SCHOOL
692
47.5
47.5
62.9
JUNIOR COLLEGE
112
7.7
7.7
70.6
BACHELOR
277
19.0
19.0
89.6
GRADUATE
152
10.4
10.4
100.0
Total
1457
100.0
100.0
Table 3 Variables Measured at the Interval-Ratio Level
SPSS Variable name
Explain exactly what this variable measures
Level of Measurement
Most appropriate measure of central tendency
age
Respondent's age in years
interval-ratio
mean 48.21 years
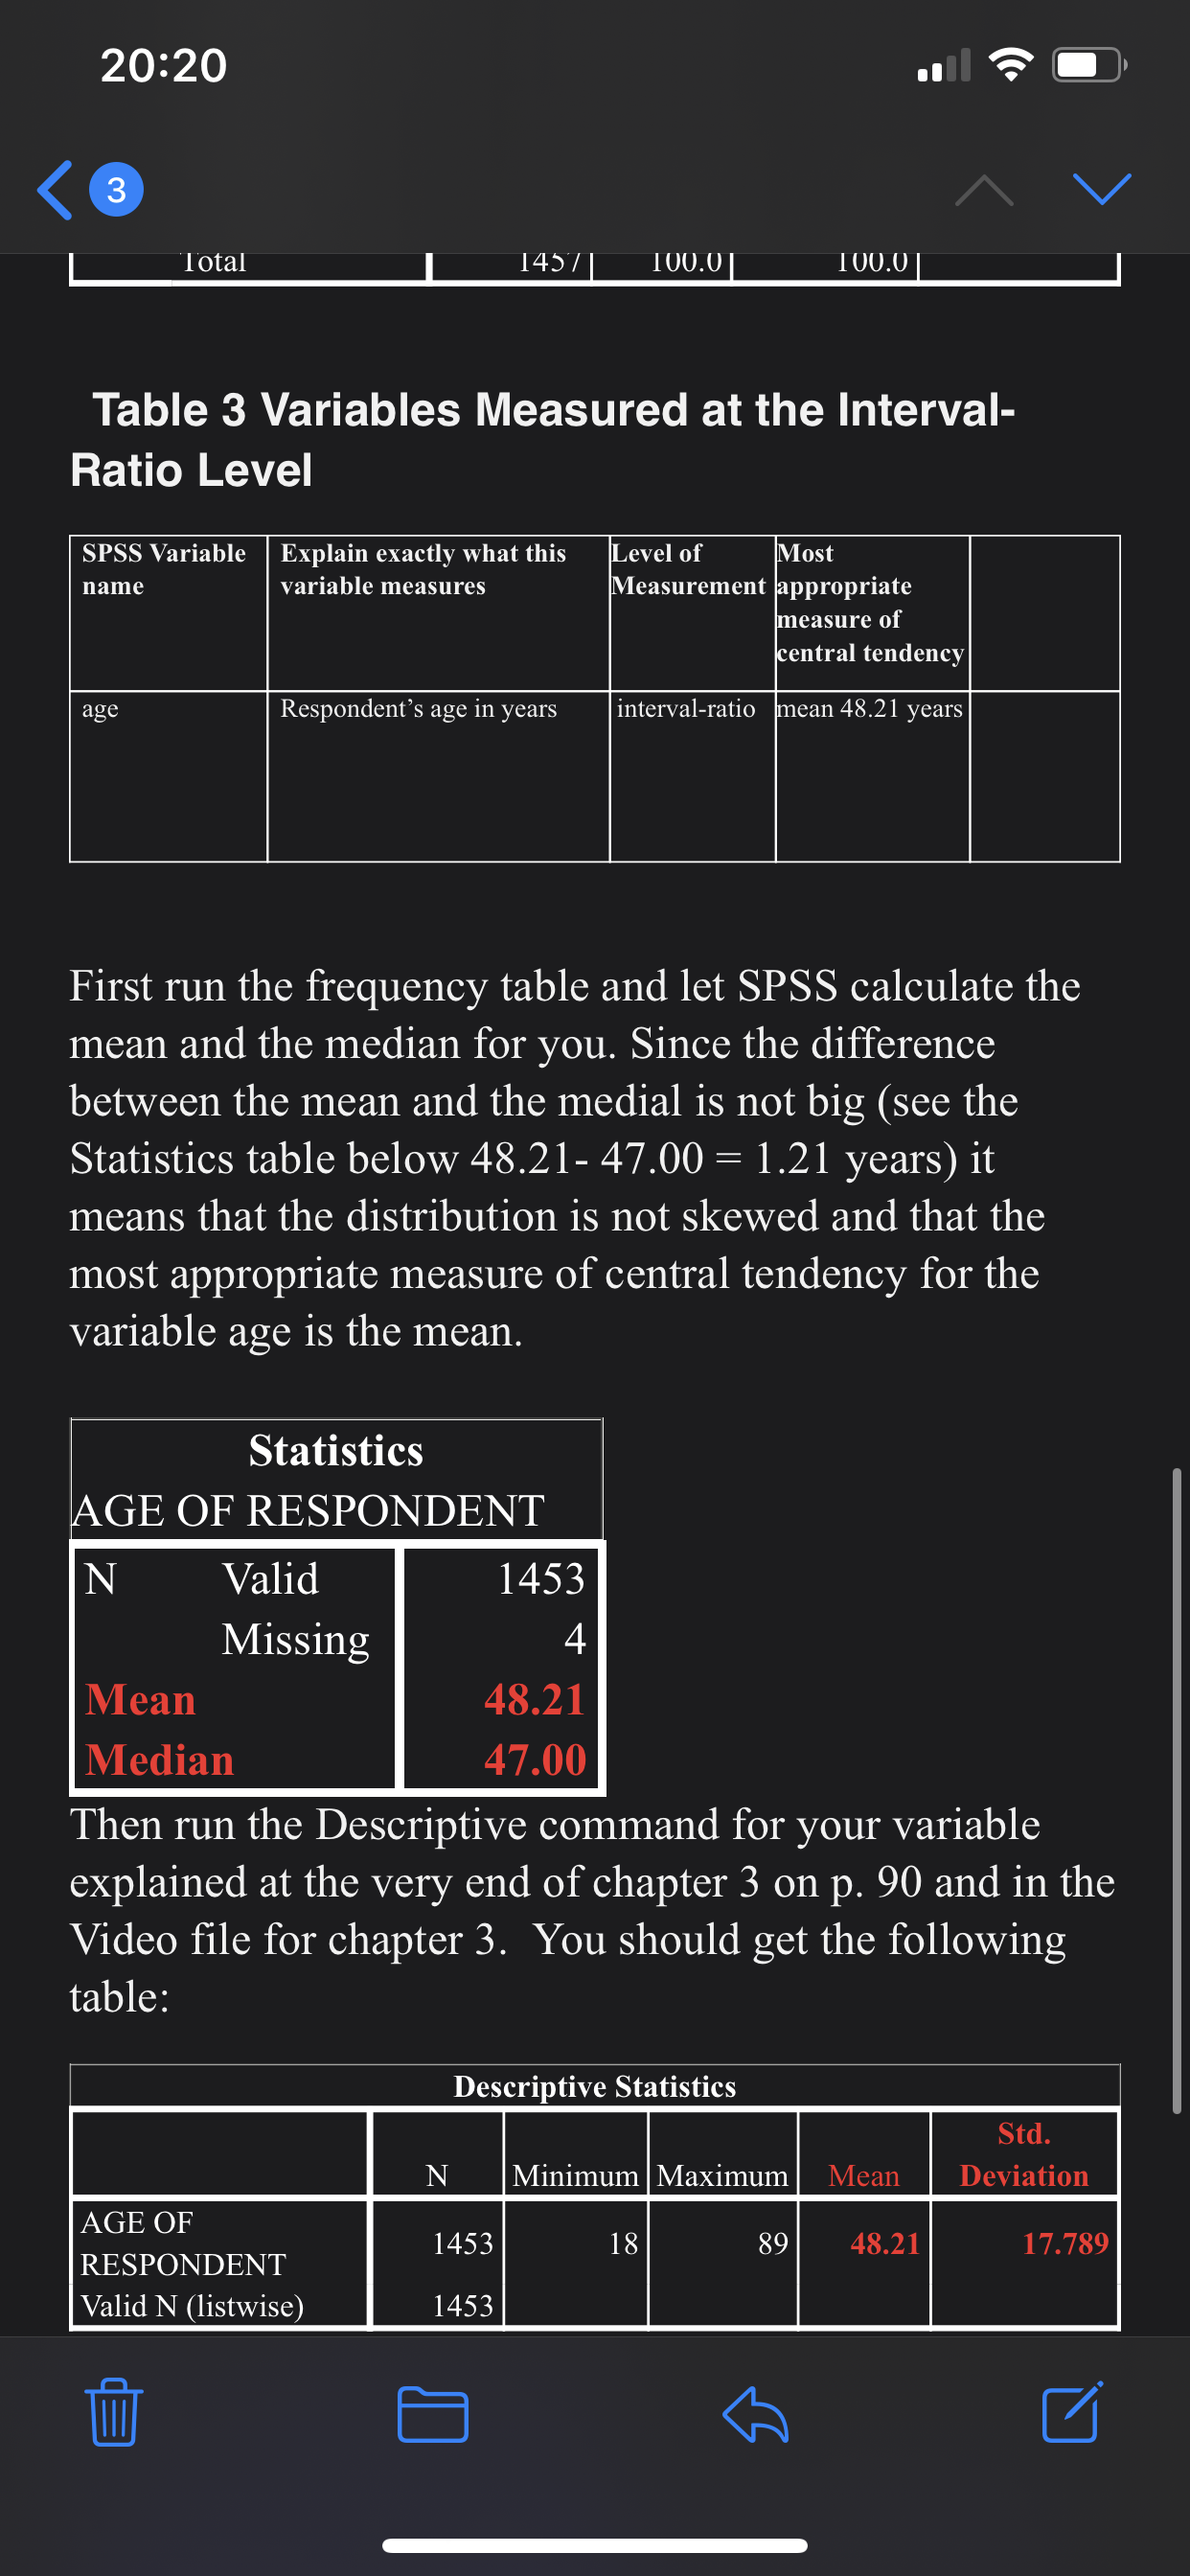
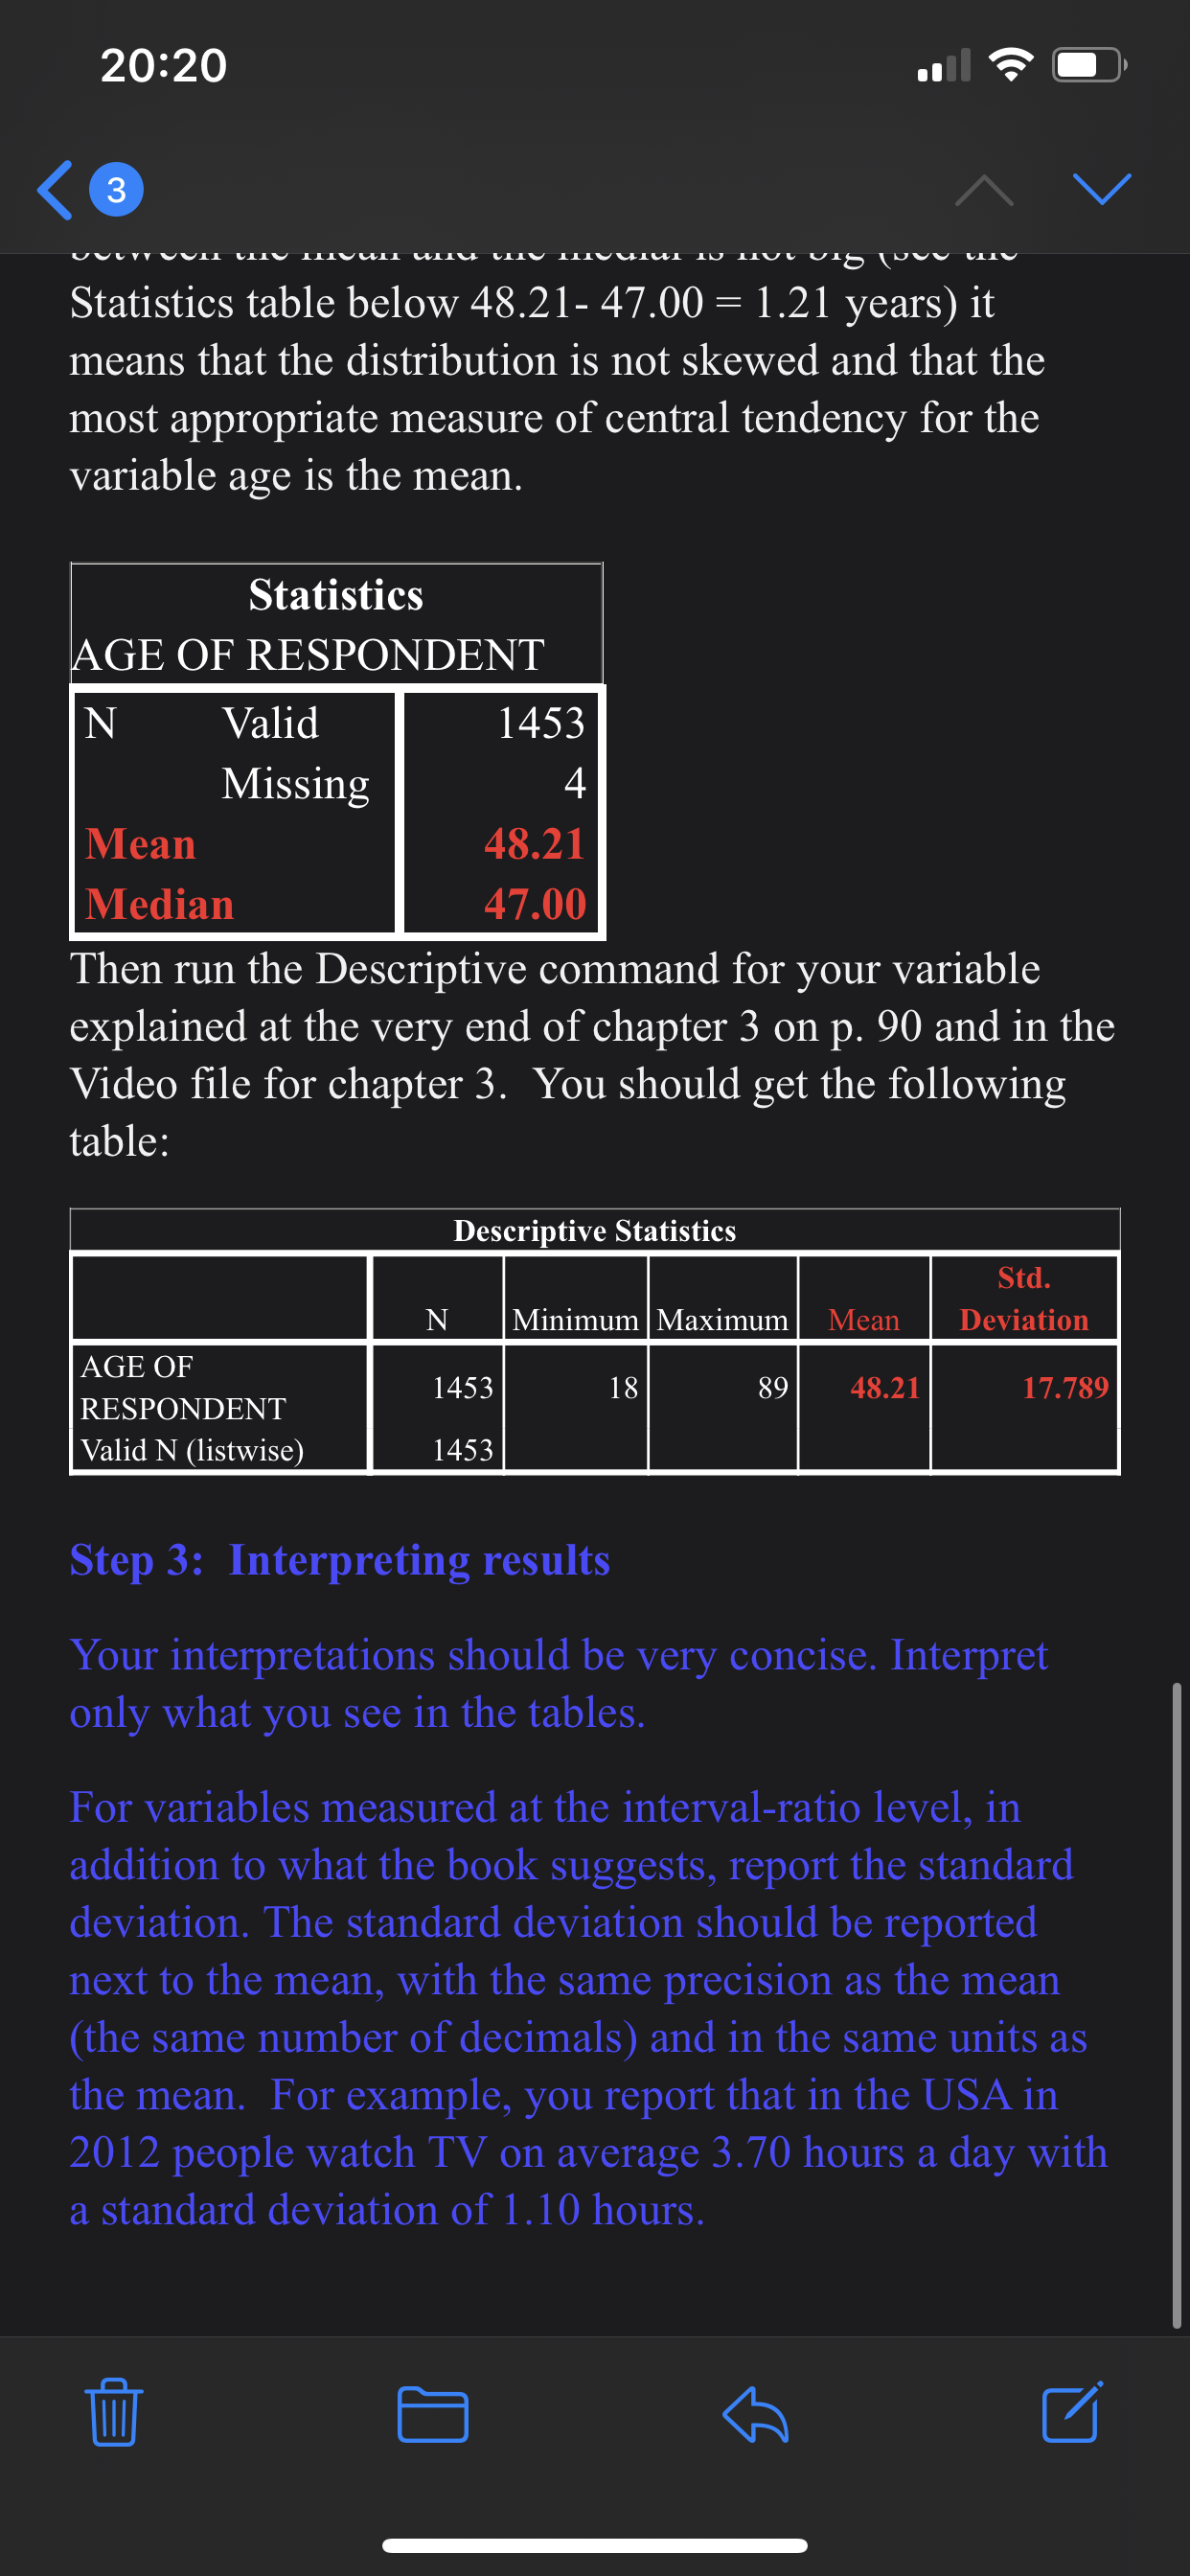
First run the frequency table and let SPSS calculate the mean and the median for you. Since the difference between the mean and the medial is not big (see the Statistics table below 48.21- 47.00 = 1.21 years) it means that the distribution is not skewed and that the most appropriate measure of central tendency for the variable age is the mean.
Statistics
AGE OF RESPONDENT
N
Valid
1453
Missing
4
Mean
48.21
Median
47.00
Then run the Descriptive command for your variable explained at the very end of chapter 3 on p. 90 and in the Video file for chapter 3.You should get the following table:
Descriptive Statistics
N
Minimum
Maximum
Mean
Std. Deviation
AGE OF RESPONDENT
1453
18
89
48.21
17.789
Valid N (listwise)
1453
Step 3:Interpreting results
Your interpretations should be very concise. Interpret only what you see in the tables.
For variables measured at the interval-ratio level, in addition to what the book suggests, report the standard deviation. The standard deviation should be reported next to the mean, with the same precision as the mean (the same number of decimals) and in the same units as the mean.For example, you report that in the USA in 2012 people watch TV on average 3.70 hours a day with a standard deviation of 1.10 hours.
Choose 2 nominal; and 2 ordinal and 2 interval-ratio variables. Do three separate tables: one for each level of measurement. Below you will find the examples for each of the three types of variables. For the interval-ratio variables, in addition to the measures of central tendency, report the standard deviation. The standard deviation should be reported next to the mean, with the same precision (the same number of decimals) and in the same units as the mean ( years, hours, times etc.) Table 1 Variables Measured at the Nominal Level SPSS Explain exactly what Variable this variable measures name The variable abanymeasures a respondent's opinion about whether or not a woman should be able to get a legal abortion if she wants it for any reason. Statistics BORTION IF WOMAN ANTS FOR ANY EASON N Valid Missing eve] of Most easurementappropriate nominal measure of central tendency mode is "no" (2) 20:20 3 Statistics ABORTION IF WOMAN WANTS FOR ANY REASON N Valid 904 Missing 553 Mode 2 ABORTION IF WOMAN WANTS FOR ANY REASON Valid Cumulative Frequency Percent Percent Percent Valid YES 408 28.0 45.1 45.1 NO 496 34.0 54.9 100.0 Total 904 62.0 100.0 Missing IAP 509 34.9 DK 32 2.2 NA 12 .8 Total 553 38.0 Total 1457 100.0 Table 2 Variables Measured at the Ordinal Level SPSS Variable Explain exactly what this Level of Most appropriate name variable measures Measurement measure of central tendency 1. Degree Respondent's highest degree ordinal median is "high obtained school" (1) (from the GSS 2012 code book) Statistics20:20 3 Table 2 Variables Measured at the Ordinal Level SPSS Variable Explain exactly what this Level of Most appropriate name variable measures Measurement measure of central tendency ordinal 1. Degree Respondent's highest degree median is "high obtained school" (1) (from the GSS 2012 code book) Statistics RS HIGHEST DEGREE N Valid 1457 Missing 0 Median 1.00 RS HIGHEST DEGREE Valid Cumulative Frequency Percent Percent Percent Valid LT HIGH SCHOOL 224 15.4 15.4 15.4 HIGH SCHOOL 692 47.5 47.5 62.9 JUNIOR COLLEGE 112 7.7 7.7 70.6 BACHELOR 277 19.0 19.0 89.6 GRADUATE 152 10.4 10.4 100.0 Total 1457 100.0 100.0 Table 3 Variables Measured at the Interval- Ratio Level SPSS Variable Explain exactly what this Level of Most name variable measures Measurement appropriate measure of central tendency age Respondent's age in years interval-ratio mean 48.21 years20:20 3 Total 1457 1 100.01 100.0 1 Table 3 Variables Measured at the Interval- Ratio Level SPSS Variable Explain exactly what this Level of Most name variable measures Measurement appropriate measure of central tendency age Respondent's age in years interval-ratio mean 48.21 years First run the frequency table and let SPSS calculate the mean and the median for you. Since the difference between the mean and the medial is not big (see the Statistics table below 48.21- 47.00 = 1.21 years) it means that the distribution is not skewed and that the most appropriate measure of central tendency for the variable age is the mean. Statistics AGE OF RESPONDENT N Valid 1453 Missing 4 Mean 48.21 Median 47.00 Then run the Descriptive command for your variable explained at the very end of chapter 3 on p. 90 and in the Video file for chapter 3. You should get the following table: Descriptive Statistics Std. N Minimum Maximum Mean Deviation AGE OF RESPONDENT 1453 18 89 48.21 17.789 Valid N (listwise) 145320:20 3 Statistics table below 48.21- 47.00 = 1.21 years) it means that the distribution is not skewed and that the most appropriate measure of central tendency for the variable age is the mean. Statistics AGE OF RESPONDENT N Valid 1453 Missing 4 Mean 48.21 Median 47.00 Then run the Descriptive command for your variable explained at the very end of chapter 3 on p. 90 and in the Video file for chapter 3. You should get the following table: Descriptive Statistics Std. N Minimum Maximum Mean Deviation AGE OF RESPONDENT 1453 18 89 48.21 17.789 Valid N (listwise) 1453 Step 3: Interpreting results Your interpretations should be very concise. Interpret only what you see in the tables. For variables measured at the interval-ratio level, in addition to what the book suggests, report the standard deviation. The standard deviation should be reported next to the mean, with the same precision as the mean (the same number of decimals) and in the same units as the mean. For example, you report that in the USA in 2012 people watch TV on average 3.70 hours a day with a standard deviation of 1.10 hours