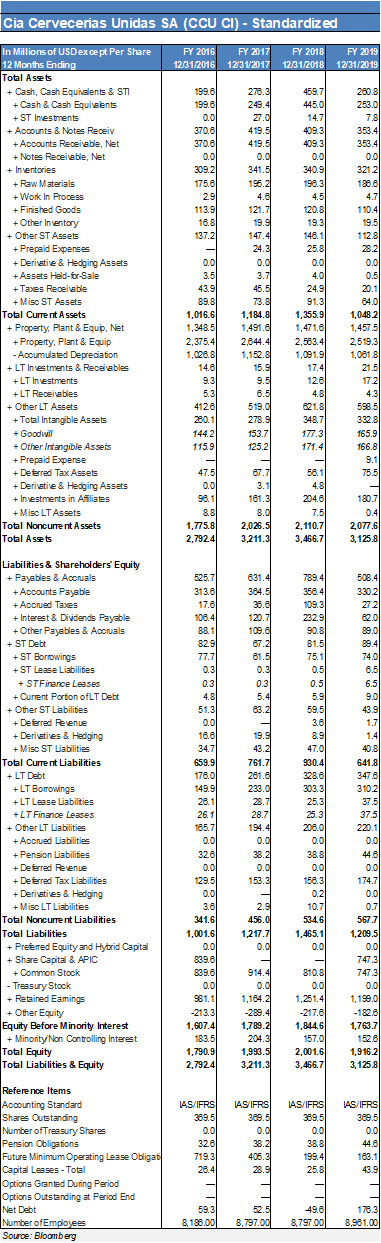
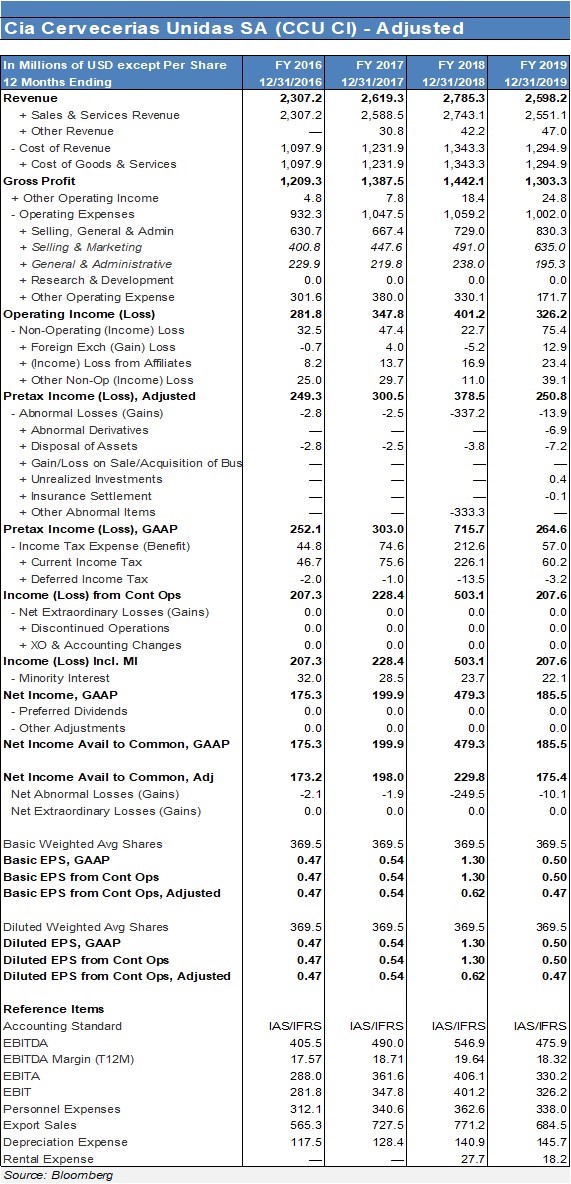
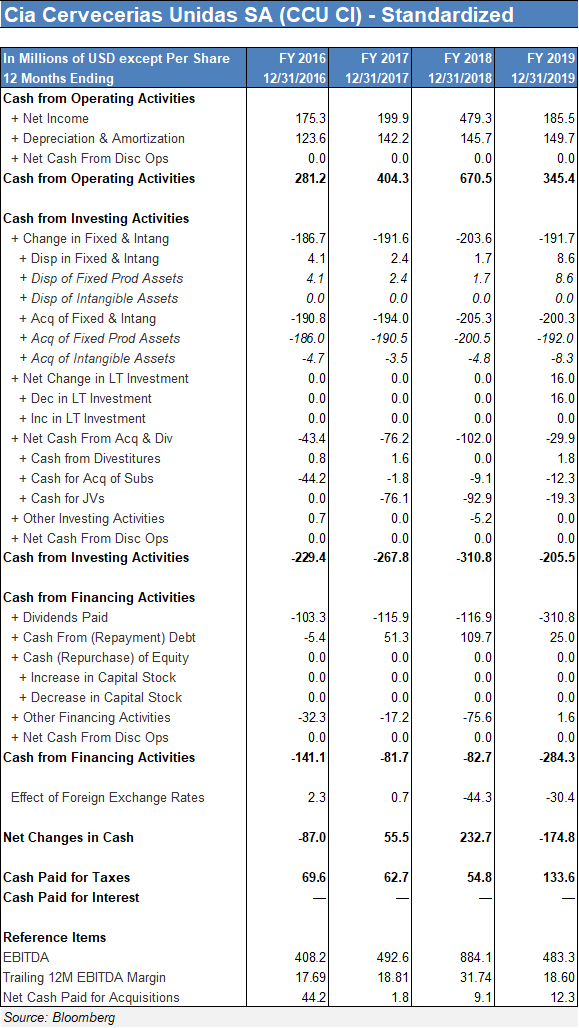
Cia Cervecerias Unidas SA (CCU CI) - Standardized In Millions of USD except Per Share FY 2016 FY 2017 FY 2018 FY 20 19 12 Months Ending 12/31/2016 12/31/2017 12/31/2018 12/31/20 19 Total Assets + Cash, Cash Equivalents & STI 199.6 276.3 459. 260 + Cash & Cash Equivalents 199.6 249.4 445.0 253.0 ST Investments 0.0 27 .0 14.7 78 + Accounts & Notes Receiv 370.6 419.5 409.3 353. + Accounts Receivable, Net 370.6 419.5 409.3 353.4 + Notes Receivable, Net 0.0 0.0 0.0 0.0 + Inventories 309.2 341.5 340.9 321 .2 Raw Materials 175.6 195.2 198.3 186.8 + Work In Process 291 4.8 4.5 4.7 Finished Goods 113.9 121.7 120.8 1 10.4 Other Inventory 16.8 19.9 19.3 19.5 Other ST Assets 137.2 147.4 148. 1 1 12.8 + Prepaid Expenses 24.3 25.8 28.2 + Derivative & Hedging Assets 0.0 0.0 0.0 0.0 + Assets Held-for-Sale 3.5 3.7 4.0 0.5 + Taxes Receivable 43.9 45.5 24.9 20.1 + Misc ST Assets B9. 8 73.8 91.3 64.0 Total Current Assets 1,016.6 1,184.8 1,355.9 1,048.2 + Property, Plant & Equip, Net 1,348.5 1,491.8 1,47 1.6 1,457 + Property, Plant & Equip 2,375.4 2.844.4 2.583.4 2,519.3 - Accumulated Depreciation 1,028.8 1,152.8 1,091.9 1,081.8 + LT Investments & Receivables 14.6 15.9 17.4 21.5 + LT Investments 9.3 9.5 126 17 2 + LT Receivables 5.3 6.5 4.8 4.3 + Other LT Assets 412.6 519.0 821.8 598. + Total Intangible Assets 280. 1 278.9 348.7 332.8 + Goodwill 144.2 153.7 177.3 165.9 + Other Intangible Assets 115.9 125.2 171.4 166.8 + Prepaid Expense 9.1 + Deferred Tax Assets 47.5 67.7 58.1 75.5 + Derivative & Hedging Assets 0.0 3.1 4.8 + Investments in Affiliates 98.1 181.3 204.8 180.7 Misc LT Assets 8.8 8.0 7.5 0.4 Total Noncurrent Assets 1,775.8 2,026.5 2,110.7 2,077.6 Total Assets 2,792.4 3,211.3 3,466.7 3, 125.8 Liabilities & Shareholders' Equity + Payables & Accruals 525.7 631.4 789.4 508. + Accounts Payable 313.6 384.5 356.4 3:302 + Accrued Taxes 17.6 33.8 109.3 27 2 + Interest & Dividends Payable 108.4 120.7 232.9 62.0 + Other Payables & Accruals 88. 1 109.6 90.8 89.0 + ST Debt 82.9 67.2 81.5 89.4 + ST Borrowings 77.7 61.5 75.1 74.0 + ST Lease Liabilities 0.3 0.3 0.5 6.5 + ST Finance Leases 0.3 0.3 0.5 6.5 Current Portion ofLT Debt 4.8 5.4 5.9 9.0 Other ST Liabilities 51.31 63.2 59.5 43.9 Deferred Revenue 0.0 3.6 1.7 + Derivatives & Hedging 18.6 19.9 8.9 1.4 + Misc ST Liabilities 34.7 43.2 47.0 40.8 Total Current Liabilities 659.9 761.7 930.4 641. + LT Debt 176.0 281. 328.6 347.6 + LT Borrowings 149.9 303.3 3102 + LT Lease Liabilities 28. 1 28.7 25.3 37 5 + LT Finance Leases 26.1 28.7 25.3 37.5 Other LT Liabilities 185.7 194.4 220.1 + Accrued Liabilities 0.0 0.0 0.0 0.0 Pension Liabilities 3261 38.2 3.8.8) 44.6 + Deferred Revenue 0.0 0.0 0.0 0.0 + Deferred Tax Liabilities 129.5 153.3 158.3 174.7 Derivatives & Hedging 0.0 0.2 0.0 + Misc LT Liabilities 3.6 2.9 10.7 0.7 Total Noncurrent Liabilities 341.6 456.0 534.6 567.7 Total Liabilities 1,001.6 1,217.7 1,465.1 1,209.5 + Preferred Equity and Hybrid Capital 0.0 0.0 0.0 0.0 + Share Capital & APIC 839.6 747.3 + Common Stock 839.8 914.4 810.8 747.3 - Treasury Stock 0.0 0.0 0.0 0.0 + Retained Eamings 98 1. 1 1,184.2 1,251.4 1,199.0 + Other Equity -213.3 289.4 -217.6 -182.6 Equity Before Minority Interest 1,607.4 1.789.2 1,844.6 1,763.7 + Minority Non Controlling Interest 183.5 204.3 157.0 152.6 Total Equity 1,790.9 1,993.5 2,001.6 1,916.2 Total Liabilities & Equity 2,792.4 3,211.3 3,466.7 3,125.8 Reference Items Accounting Standard IAS/IFRS IAS/ IFRS IAS/IFRS LAS/IFRS Shares Outstanding 389.5 389.6 389.5 389.5 Number of Treasury Shares 0.0 0.0 0.0 0.0 Pension Obligations 326 38.2 38.8 44.8 Future Minimum Operating Lease Obligat 719. 405.3 199.4 163.1 Capital Leases - Total 28.4 28.9 25.8 43.9 Options Granted During Period Options Outstanding at Period End Net Debt 39.3 62.5 49.6 176.3 Number of Employees 8 186.00 8,797.00 8,797 .00 8,981.00 Source: BloombergCia Cervecerias Unidas SA (CCU CI) - Adjusted In Millions of USD except Per Share FY 2016 FY 2017 FY 2018 FY 2019 12 Months Ending 12/31/2016 12/31/2017 12/31/2018 12/31/2019 Revenue 2,307.2 2,619.3 2,785.3 2,598.2 + Sales & Services Revenue 2,307.2 2,588.5 2,743.1 2,551.1 + Other Revenue 30.8 47.0 Cost of Revenue 1,097.9 1,231.9 1,343.3 1,294.9 + Cost of Goods & Services 1,097.9 1,231.9 1,343.3 1,294.9 Gross Profit 1,209.3 1,387.5 1,442.1 1,303.3 + Other Operating Income 4.8 7.8 18.4 24.8 Operating Expenses 932.3 1,047.5 1,059.2 1,002.0 + Selling, General & Admin 630.7 667.4 729.0 830.3 + Selling & Marketing 400.8 447.6 491.0 635.0 + General & Administrative 229.9 219.8 238.0 195.3 + Research & Development 0.0 0.0 0.0 0.0 + Other Operating Expense 301.6 380.0 330.1 171.7 Operating Income (Loss) 281.8 347.8 401.2 326.2 - Non-Operating (Income) Loss 32.5 47.4 22.7 75.4 + Foreign Exchangess -0.7 4.0 5.2 12.9 + (Income) Loss from Affiliates 8.2 13.7 16.9 23.4 + Other Non-Op (Income) Loss 25.0 29.7 11.0 39.1 Pretax Income (Loss), Adjusted 249.3 300.5 378.5 250.8 - Abnormal Losses (Gains) 2.8 -2.5 -337.2 -13.9 + Abnormal Derivatives -6.9 + Disposal of Assets -2.8 -2.5 3.8 7.2 + Gain/Loss on Sale/Acquisition of Bus + Unrealized Investments 0.4 + Insurance Settlement 1 -0.1 + Other Abnormal Items -333.3 Pretax Income (Loss), GAAP 252.1 303.0 715.7 264.6 - Income Tax Expense (Benefit) 44.8 74.6 212.6 57.0 + Current Income Tax 46.7 75.6 226.1 60.2 + Deferred Income Tax -2.0 -1.0 -13.5 -3.2 Income (Loss) from Cont Ops 207.3 228.4 503.1 207.6 Net Extraordinary Losses (Gains) 0.0 0.0 0.0 0.0 + Discontinued Operations 0.0 0.0 D.0 0.0 + XO & Accounting Changes 0.0 0.0 0.0 0.0 Income (Loss) Incl. MI 207.3 228.4 503.1 207.6 - Minority Interest 32.0 28.5 23.7 22.1 Net Income, GAAP 175.3 199.9 479.3 185.5 Preferred Dividends 0.0 0.0 D.0 0.0 - Other Adjustments 0.0 0.0 0.0 0.0 Net Income Avail to Common, GAAP 175.3 199.9 479.3 185.5 Net Income Avail to Common, Adj 173.2 198.0 229.8 175.4 Net Abnormal Losses (Gains) -2.1 -1.9 -249.5 -10.1 Net Extraordinary Losses (Gains) 0.0 0.0 0.0 0.C Basic Weighted Avg Shares 369.5 369.5 369.5 369.5 Basic EPS, GAAP 0.47 0.54 1.30 0.50 Basic EPS from Cont Ops 0.47 0.54 1.30 0.50 Basic EPS from Cont Ops, Adjusted 0.47 0.54 0.62 0.47 Diluted Weighted Avg Shares 369.5 369.5 369.5 369.5 Diluted EPS, GAAP 0.47 0.54 1.30 0.50 Diluted EPS from Cont Ops 0.47 0.54 1.30 0.50 Diluted EPS from Cont Ops, Adjusted 0.47 0.54 0.62 0.47 Reference Items Accounting Standard IAS/IFRS IAS/IFRS IAS/IFRS IAS/IFRS EBITDA 405.5 490.0 546.9 475.9 EBITDA Margin (T12M) 17.57 18.71 19.64 18.32 EBITA 288.0 361.6 406.1 330.2 EBIT 281.8 347.8 401.2 326.2 Personnel Expenses 312.1 340.6 362.6 338.0 Export Sales 565.3 727.5 771.2 684.5 Depreciation Expense 117.5 128.4 140.9 145.7 Rental Expense 27.7 18.2 Source: BloombergCia Cervecerias Unidas SA (CCU CI) - Standardized In Millions of USD except Per Share FY 2016 FY 2017 FY 2018 FY 2019 12 Months Ending 12/31/2016 12/31/2017 12/31/2018 12/31/2019 Cash from Operating Activities + Net Income 175.3 199.9 479.3 185.5 + Depreciation & Amortization 123.6 142.2 145.7 149.7 + Net Cash From Disc Ops 0.0 0.0 0.0 0.0 Cash from Operating Activities 281.2 404.3 670.5 345.4 Cash from Investing Activities + Change in Fixed & Intang -186.7 -191.6 -203.6 -191.7 + Disp in Fixed & Intang 4.1 2.4 1.7 8.6 + Disp of Fixed Prod Assets 4. 1 2.4 1.7 8.6 + Disp of Intangible Assets 0.0 0.0 0.0 0.0 + Acq of Fixed & Intang -190.8 -194.0 -205.3 -200.3 + Acq of Fixed Prod Assets -186.0 -190.5 -200.5 -192.0 + Acq of Intangible Assets -4.7 -3.5 -4.8 -8.3 + Net Change in LT Investment 0.0 0.0 0.0 16.0 + Dec in LT Investment 0.0 0.0 0.0 16.0 + Inc in LT Investment 0.0 0.0 0.0 0.0 + Net Cash From Acq & Div 43.4 -76.2 102.0 -29.9 + Cash from Divestitures 0.8 1.6 0.0 1.8 + Cash for Acq of Subs -44.2 -1.8 -9.1 -12.3 + Cash for JVs 0.0 -76.1 -92.9 -19.3 + Other Investing Activities 0.7 0.0 -5.2 0.0 + Net Cash From Disc Ops 0.0 0.0 0.0 0.0 Cash from Investing Activities 229.4 -267.8 -310.8 -205.5 Cash from Financing Activities + Dividends Paid -103.3 -115.9 -116.9 310.8 + Cash From (Repayment) Debt -5.4 51.3 109.7 25.0 + Cash (Repurchase) of Equity 0.0 0.0 0.0 0.0 + Increase in Capital Stock 0.0 0.0 0.0 0.0 + Decrease in Capital Stock 0.0 0.0 0.0 0.0 + Other Financing Activities -32.3 -17.2 -75.6 1.6 + Net Cash From Disc Ops 0.0 0.0 0.0 0.0 Cash from Financing Activities -141.1 81.7 -82.7 -284.3 Effect of Foreign Exchange Rates 2.3 0.7 -44.3 -30.4 Net Changes in Cash 87.0 55.5 232.7 -174.8 Cash Paid for Taxes 69.6 62.7 54.8 133.6 Cash Paid for Interest Reference Items EBITDA 408.2 492.6 884.1 483.3 Trailing 12M EBITDA Margin 17.69 18.81 31.74 18.60 Net Cash Paid for Acquisitions 44.2 1.8 9.1 12.3 Source: Bloomberg