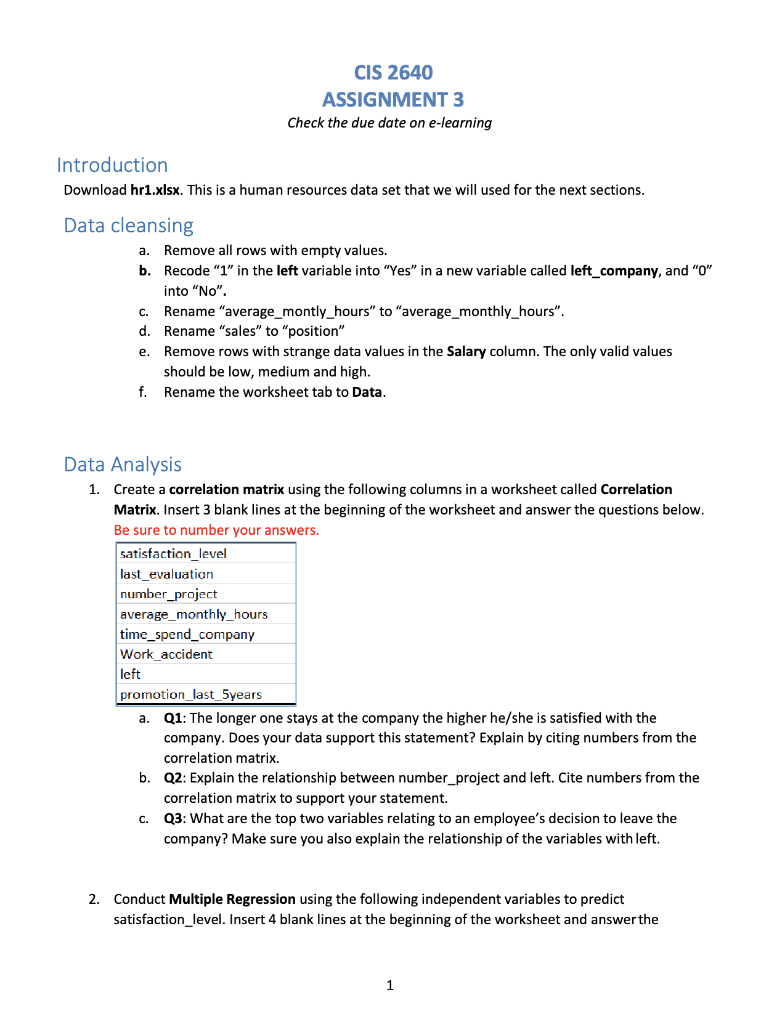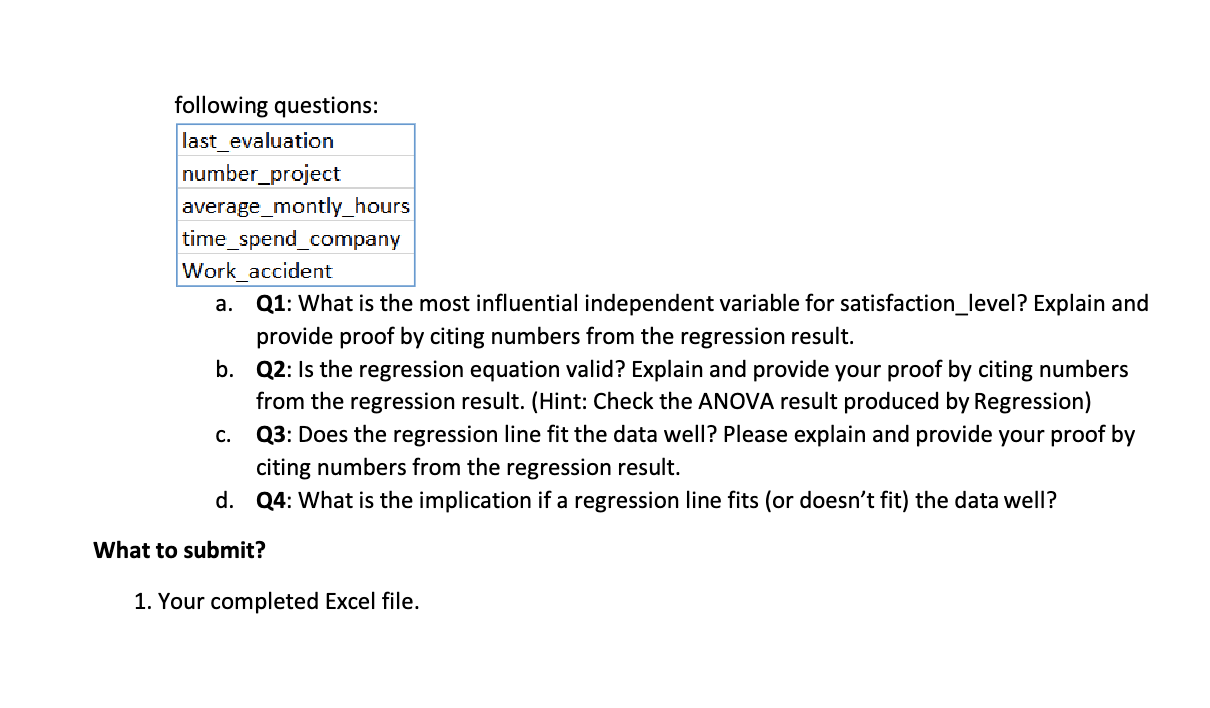

CIS 2640 ASSIGNMENT 3 Check the due date on e-learning Introduction Download hr1.xlsx. This is a human resources data set that we will used for the next sections. Data cleansing a. Remove all rows with empty values. b. Recode "1" in the left variable into "Yes" in a new variable called left_company, and "O" into "No". C. Rename "average_montly_hours" to "average_monthly_hours". d. Rename "sales" to "position" e. Remove rows with strange data values in the Salary column. The only valid values should be low, medium and high. Rename the worksheet tab to Data. f. Data Analysis 1. Create a correlation matrix using the following columns in a worksheet called Correlation Matrix. Insert 3 blank lines at the beginning of the worksheet and answer the questions below. Be sure to number your answers. satisfaction level last_evaluation number_project average_monthly_hours time_spend_company Work_accident left promotion_last_5years a. Q1: The longer one stays at the company the higher he/she is satisfied with the company. Does your data support this statement? Explain by citing numbers from the correlation matrix. b. Q2: Explain the relationship between number_project and left. Cite numbers from the correlation matrix to support your statement. Q3: What are the top two variables relating to an employee's decision to leave the company? Make sure you also explain the relationship of the variables with left. C. 2. Conduct Multiple Regression using the following independent variables to predict satisfaction_level. Insert 4 blank lines at the beginning of the worksheet and answer the 1 following questions: last_evaluation number_project average_montly_hours time_spend_company Work_accident a. Q1: What is the most influential independent variable for satisfaction_level? Explain and provide proof by citing numbers from the regression result. b. Q2: Is the regression equation valid? Explain and provide your proof by citing numbers from the regression result. (Hint: Check the ANOVA result produced by Regression) c. Q3: Does the regression line fit the data well? Please explain and provide your proof by citing numbers from the regression result. d. 24: What is the implication if a regression line fits (or doesn't fit) the data well? What to submit? 1. Your completed Excel file. CIS 2640 ASSIGNMENT 3 Check the due date on e-learning Introduction Download hr1.xlsx. This is a human resources data set that we will used for the next sections. Data cleansing a. Remove all rows with empty values. b. Recode "1" in the left variable into "Yes" in a new variable called left_company, and "O" into "No". C. Rename "average_montly_hours" to "average_monthly_hours". d. Rename "sales" to "position" e. Remove rows with strange data values in the Salary column. The only valid values should be low, medium and high. Rename the worksheet tab to Data. f. Data Analysis 1. Create a correlation matrix using the following columns in a worksheet called Correlation Matrix. Insert 3 blank lines at the beginning of the worksheet and answer the questions below. Be sure to number your answers. satisfaction level last_evaluation number_project average_monthly_hours time_spend_company Work_accident left promotion_last_5years a. Q1: The longer one stays at the company the higher he/she is satisfied with the company. Does your data support this statement? Explain by citing numbers from the correlation matrix. b. Q2: Explain the relationship between number_project and left. Cite numbers from the correlation matrix to support your statement. Q3: What are the top two variables relating to an employee's decision to leave the company? Make sure you also explain the relationship of the variables with left. C. 2. Conduct Multiple Regression using the following independent variables to predict satisfaction_level. Insert 4 blank lines at the beginning of the worksheet and answer the 1 following questions: last_evaluation number_project average_montly_hours time_spend_company Work_accident a. Q1: What is the most influential independent variable for satisfaction_level? Explain and provide proof by citing numbers from the regression result. b. Q2: Is the regression equation valid? Explain and provide your proof by citing numbers from the regression result. (Hint: Check the ANOVA result produced by Regression) c. Q3: Does the regression line fit the data well? Please explain and provide your proof by citing numbers from the regression result. d. 24: What is the implication if a regression line fits (or doesn't fit) the data well? What to submit? 1. Your completed Excel file


